Modes of operation
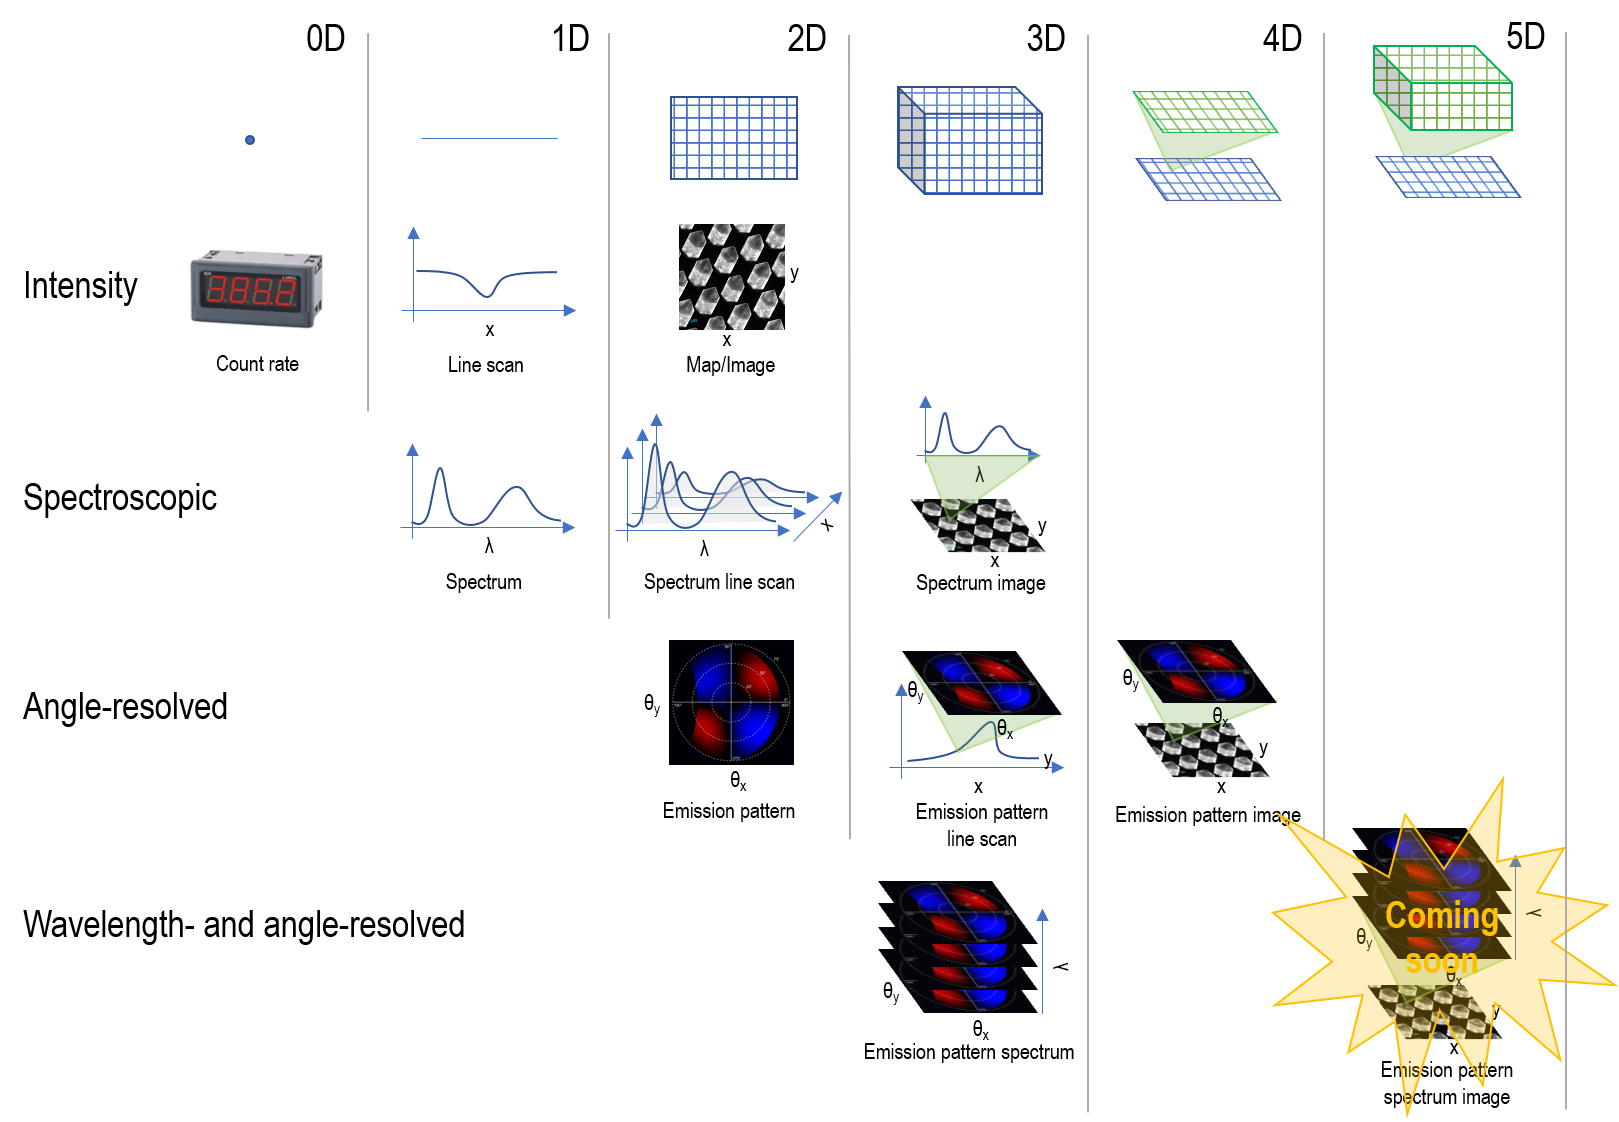
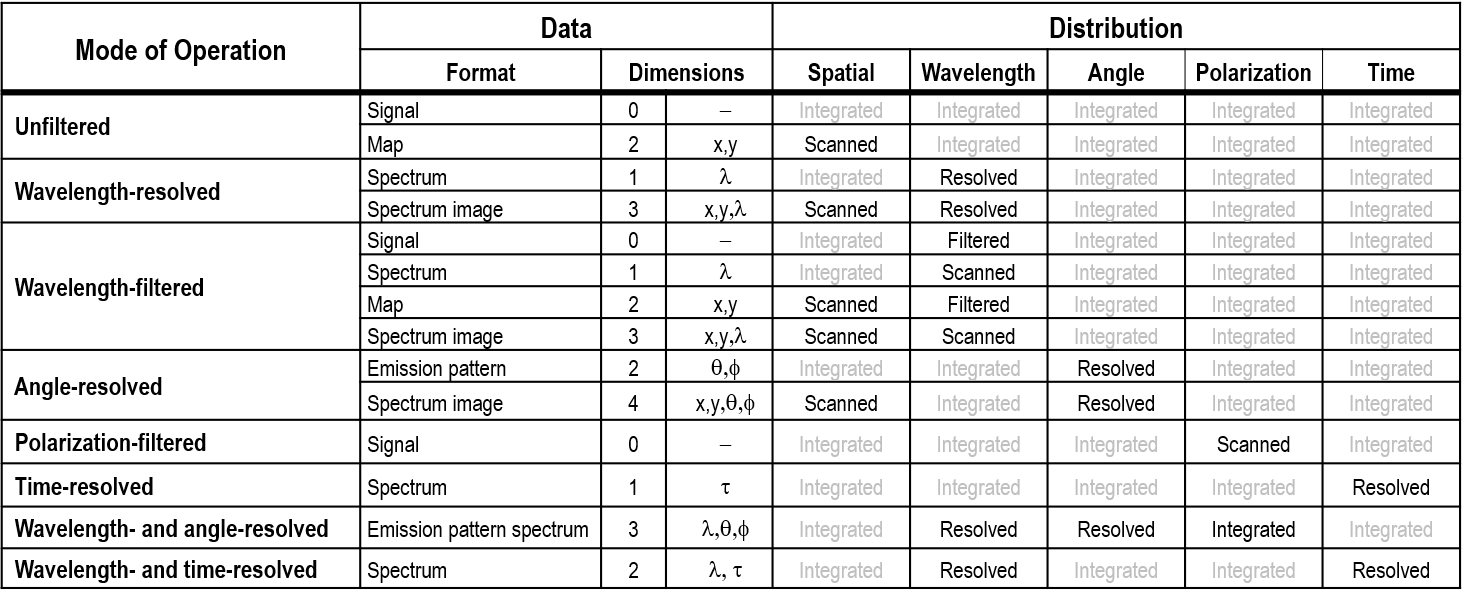
You can define the light emission during the cathodoluminescence (CL) process by its distributions in:
- Wavelength (color or energy)
- Angle (momentum)
- Polarization
- Time
During a CL measurement, you can analyze one or more of these distributions. Analyses can originate from a single, user-defined spot or area on the surface of a specimen or in a spatially resolved manner. In other words, when the electron beam scans across the specimen surface in a pre-defined pattern, it captures the light distribution(s) of interest at each step.
The term –filtered describes analysis modes that select a single or small range of wavelength, angle, or polarization distributions, whereas –resolved designates recording an entire distribution (in parallel).
In some advanced analysis methods, you can measure more than one distribution. In these cases, the data may be described in a string—for example, polarization-filtered emission pattern or wavelength– and time-resolved spectrum.
For a more detailed chart, please see the download that is available.
 |
Investigating the optical properties of nanophotonic materials far below the diffraction limit |
Infrared Wavelengths
Unfiltered
Overview
In unfiltered mode, the intensity (magnitude) of the cathodoluminescence (CL) signal is measured. The measurement is integrated over all wavelengths, angles, and polarizations for a defined time interval.
Sometimes referred to as panchromatic, polychromatic, or black-and-white imaging.
Data collection
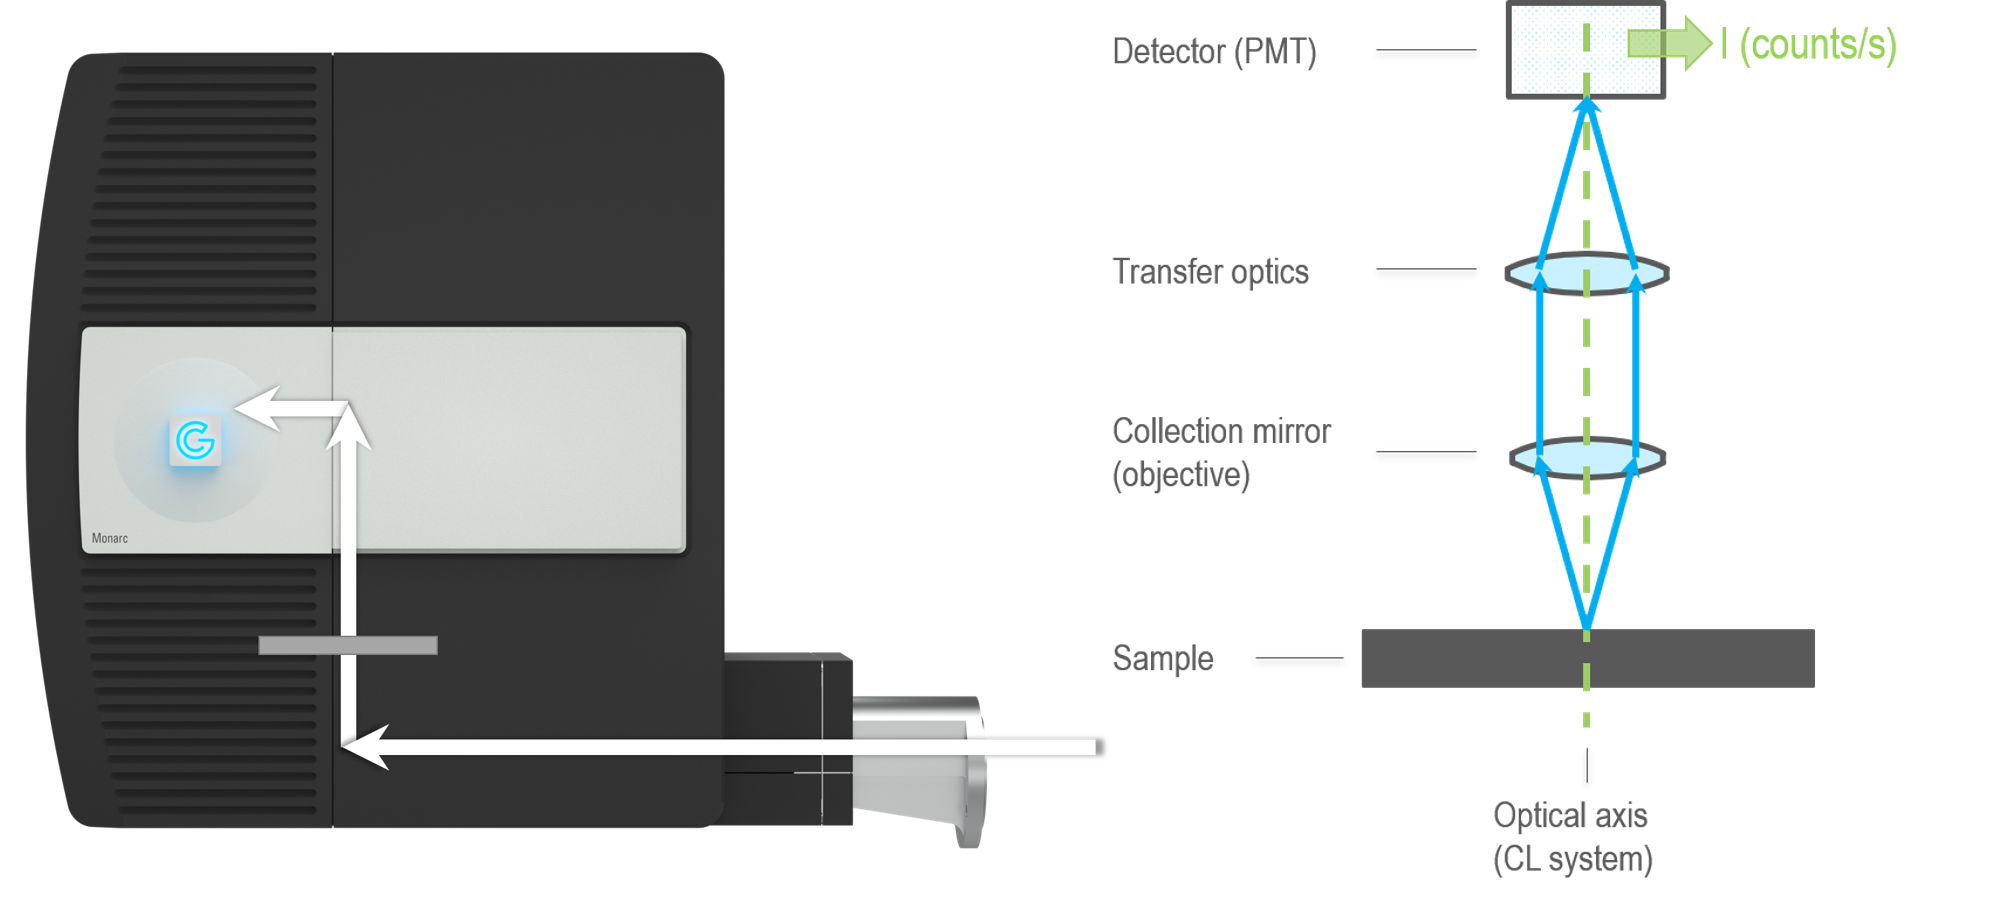
 Unfiltered signal: The magnitude of the total CL signal (count rate or intensity) is measured using a light-sensitive detector such as a photomultiplier tube (PMT) or solid-state diode. The electron beam of the electron microscope may be continuously positioned at a defined location on the specimen (spot mode) or scanned rapidly over a defined area, and the measured CL signal is integrated over all locations.
 Unfiltered map: The electron beam is scanned across the specimen surface, and the emitted light intensity is recorded at each location and displayed as a map.
Uses
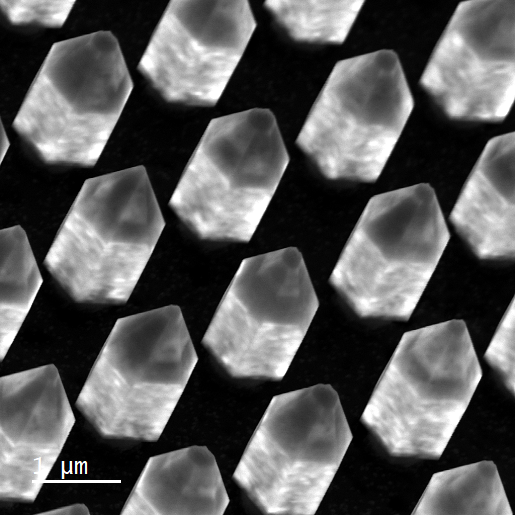
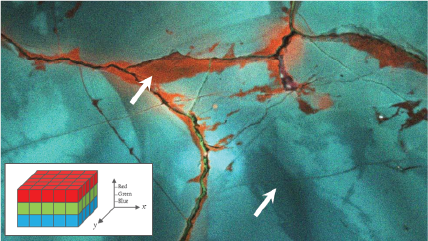
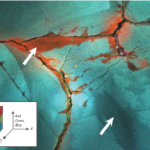
Reveal texture in mineralogy, zonation, overgrowths, and micro-cracks; and reveal extended defects in semiconductor materials and devices.
 |
Cathodoluminescence techniques for the geosciences |
Wavelength-Resolved
Overview
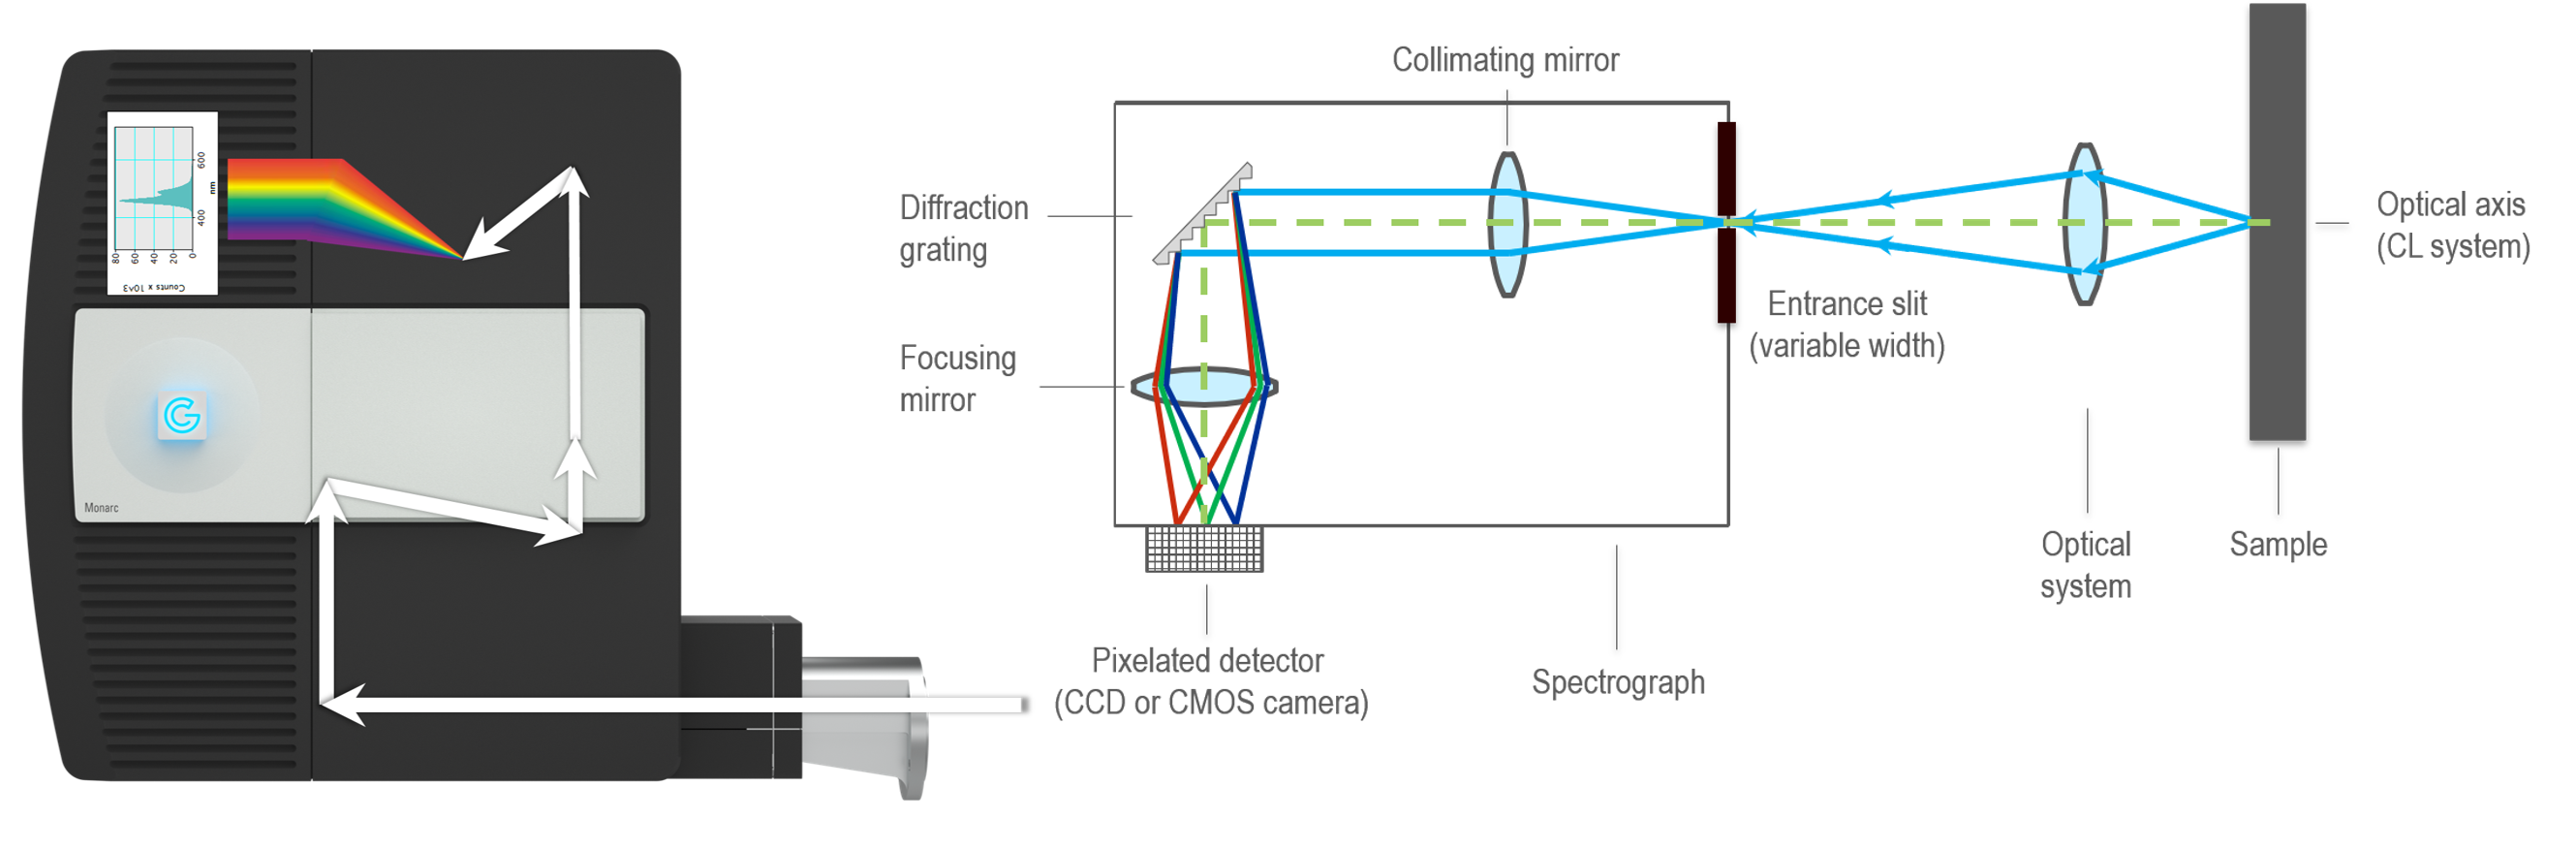
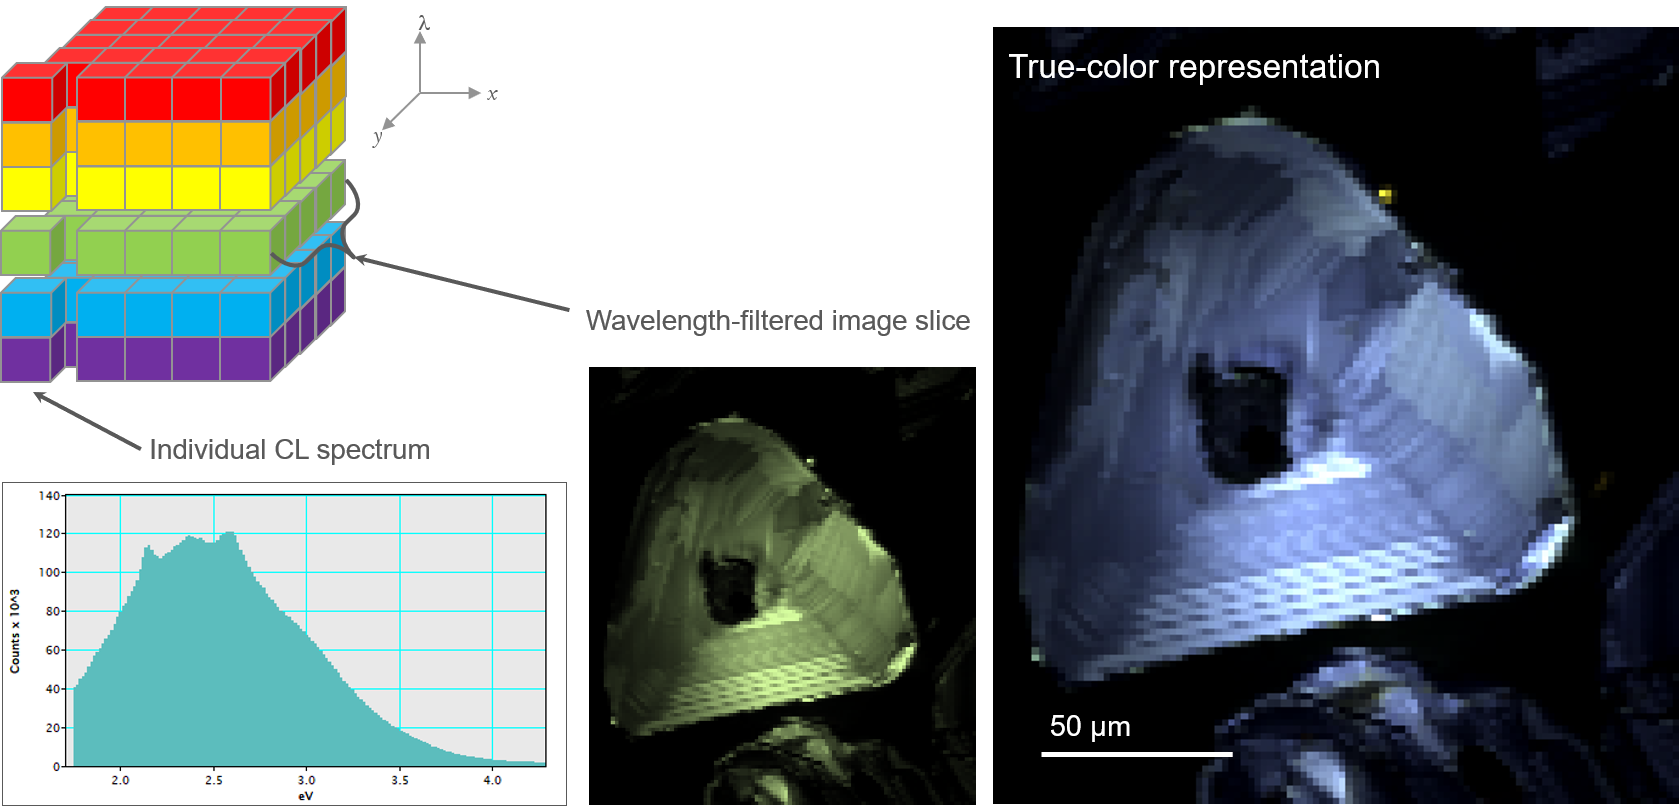
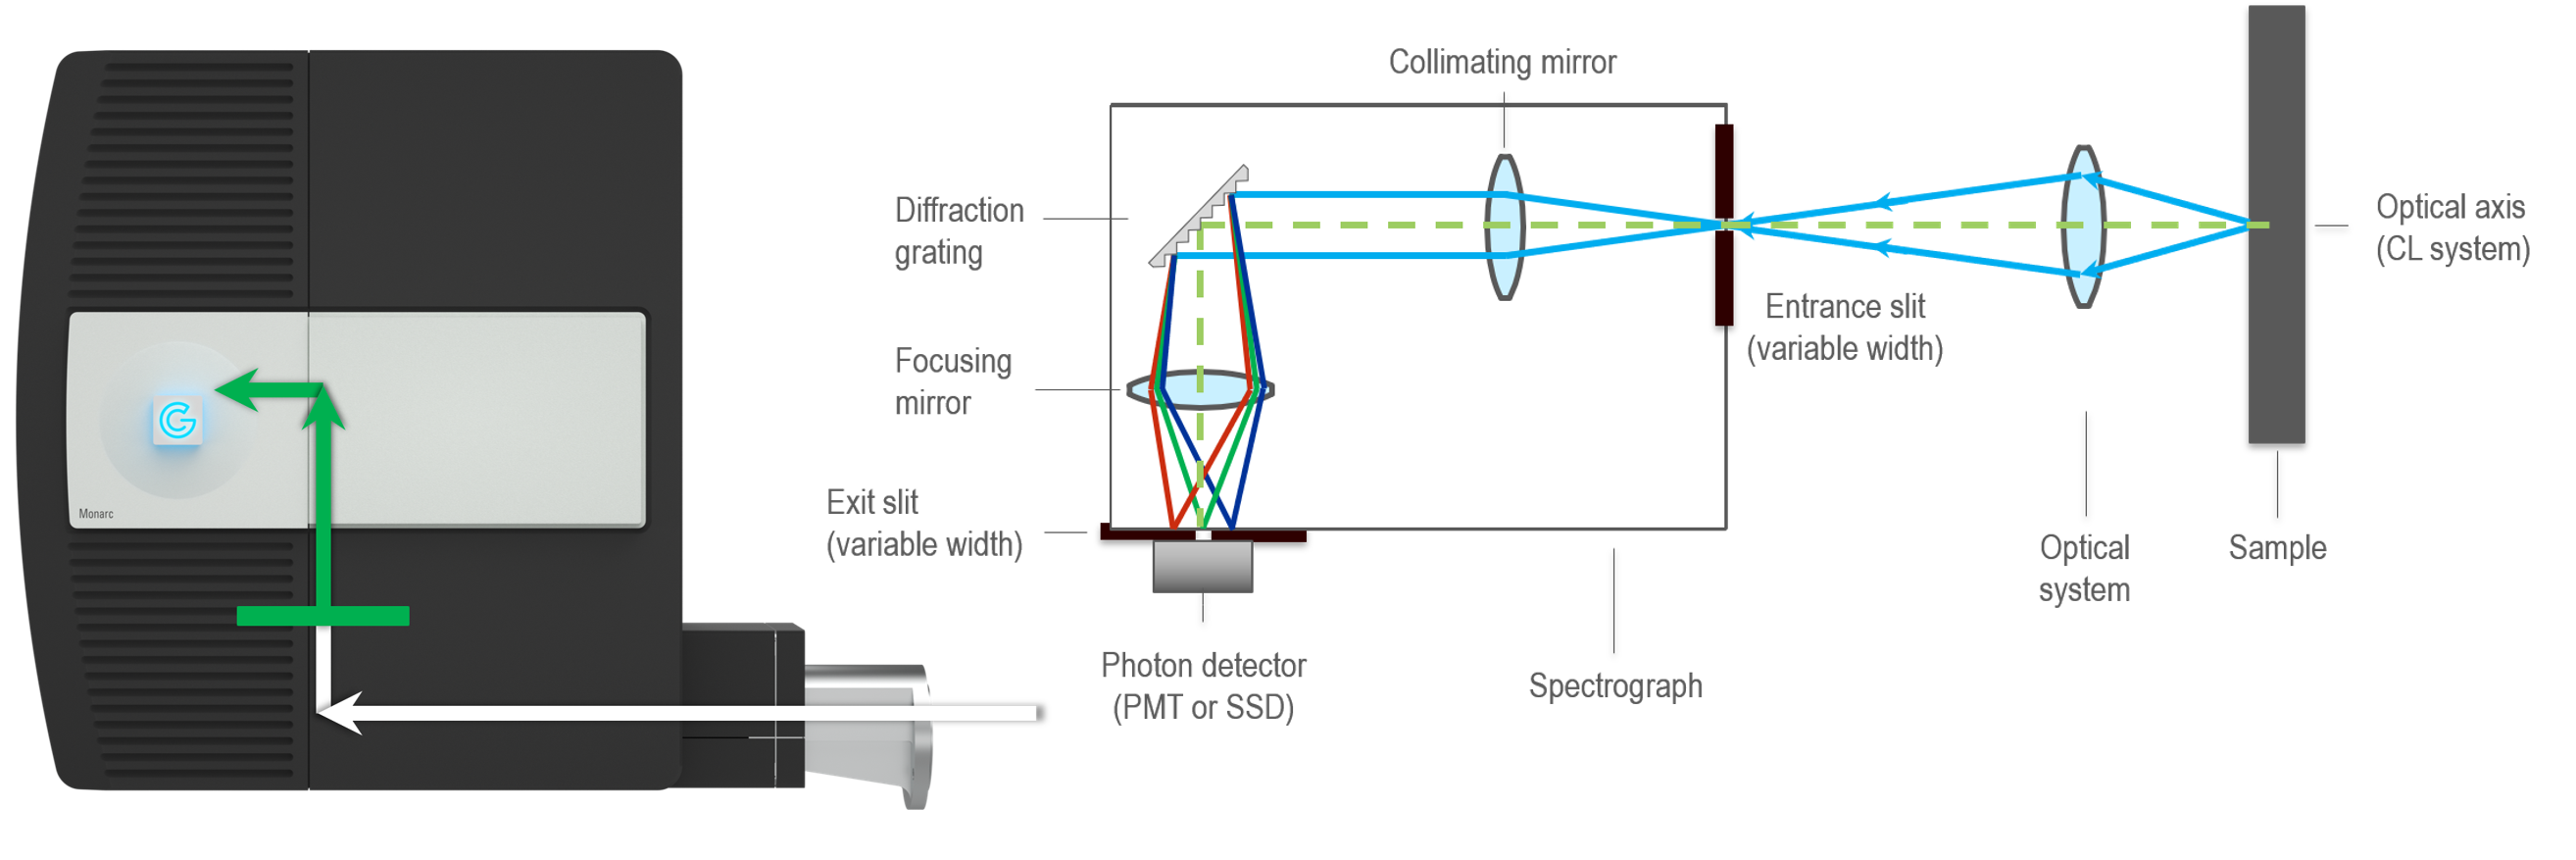
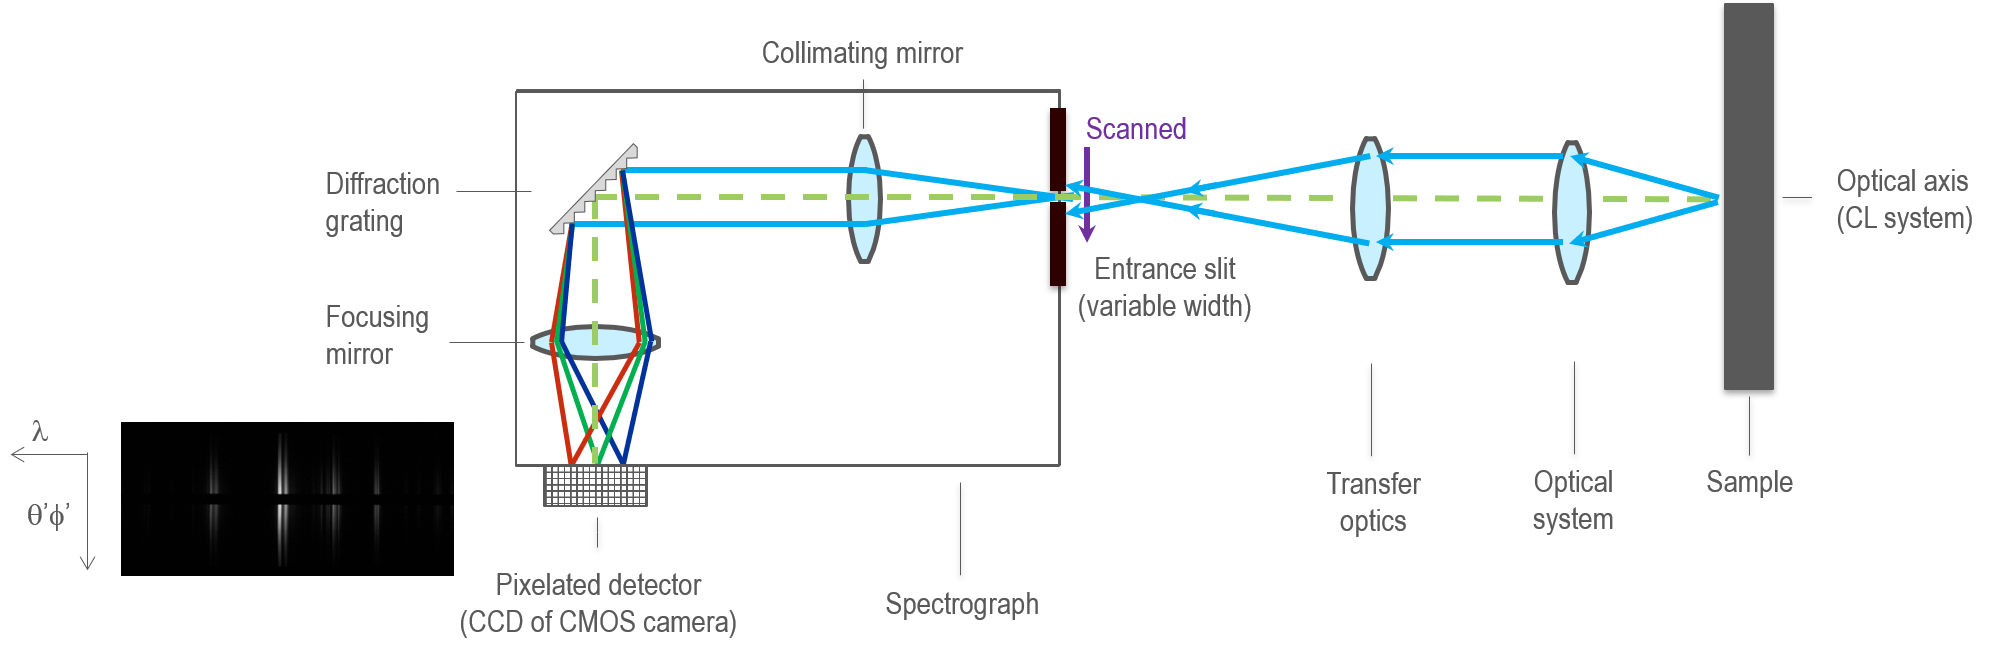
In wavelength-resolved mode, the wavelength distribution of the emitted light is analyzed. Light collected from the specimen is focused onto the entrance slit of a spectrograph that disperses light by wavelength (energy) using a pixelated detector to record a wavelength spectrum—a histogram displaying the intensity of light by wavelength.
Sometimes referred to as hyperspectral cathodoluminescence analysis or wavelength imaging.
Data collection
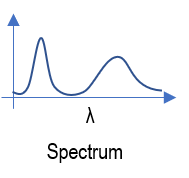 Wavelength-resolved spectrum: The wavelength distribution of emitted light is recorded from a point or region of the sample exposed to the electron beam of the electron microscope. One-dimensional data is displayed by plotting a histogram of count rate (intensity) versus wavelength or energy—wavelength and energy being inversely proportional.
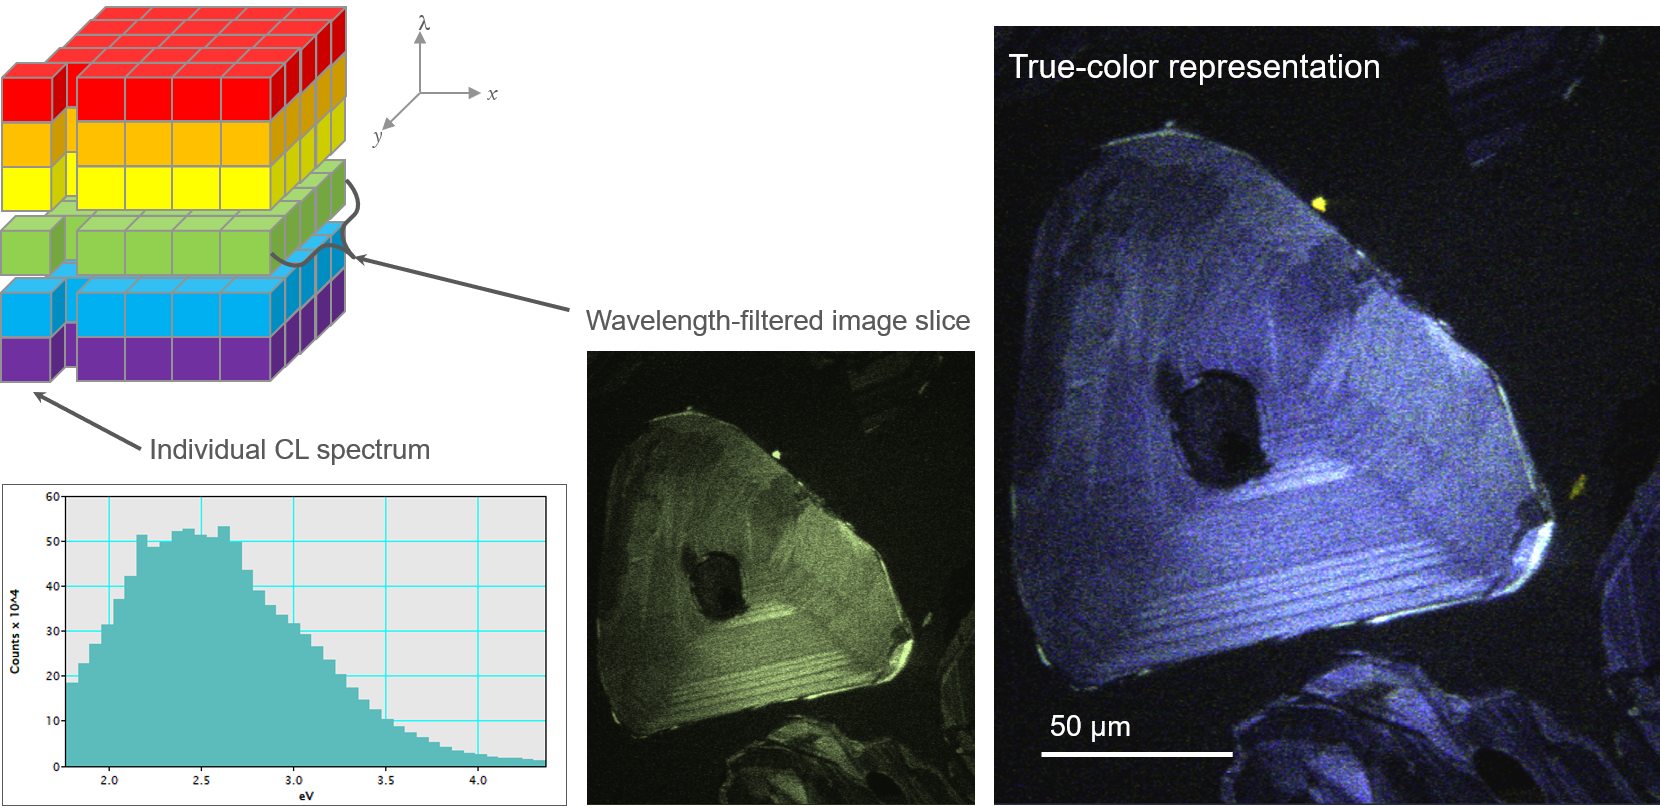
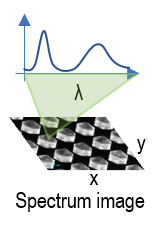 Wavelength-resolved spectrum image: The electron beam is scanned across the specimen surface in a pre-defined pattern, and a wavelength-resolved spectrum is recorded at each location, creating hyperspectral (3D) data.
Uses
Identify compounds and phases, determine the electronic structure, reveal and determine trace elements, and map composition and/or stress.
 |
 |
| Determining photonic band structure by energy-momentum spectroscopy in an electron microscope | Cathodoluminescence techniques for the geosciences |
Wavelength-Filtered
Overview
In wavelength-filtered mode, cathodoluminescence (CL) information is captured using only a (narrow) range of wavelengths. Typically, wavelength filtering is performed by detecting the light that passes through the wavelength-selecting (exit) slit of a scanning spectrometer or an optical transmission filter. An optical spectrometer provides the greatest flexibility in selecting the wavelength and wavelength range (band pass). Still, images generated in this way have a more inferior signal-to-noise ratio than an equivalent image captured using an optical filter due to higher losses through the spectrometer. However, having hundreds (or thousands) of optical filters with the desired transmission parameters is impractical, so scanning spectrometers are used widely.
Sometimes referred to as monochromatic imaging or spectral imaging.
Data collection
Wavelength-filtered signal: The intensity of the emitted light recorded from a point or region of the sample exposed to the electron beam of the scanning electron microscope (SEM). The signal is limited to a small range of (user-defined) wavelengths; no angle or polarization information is contained.
Wavelength-filtered spectrum: The wavelength distribution of the emitted light is captured. The wavelength-filtered signal is recorded over a user-defined range of wavelengths, one wavelength at a time. A scanning spectrometer is used to step through the wavelength range to build up a spectrum in a (wavelength) step-by-step approach. Sometimes referred to as serial spectroscopy.
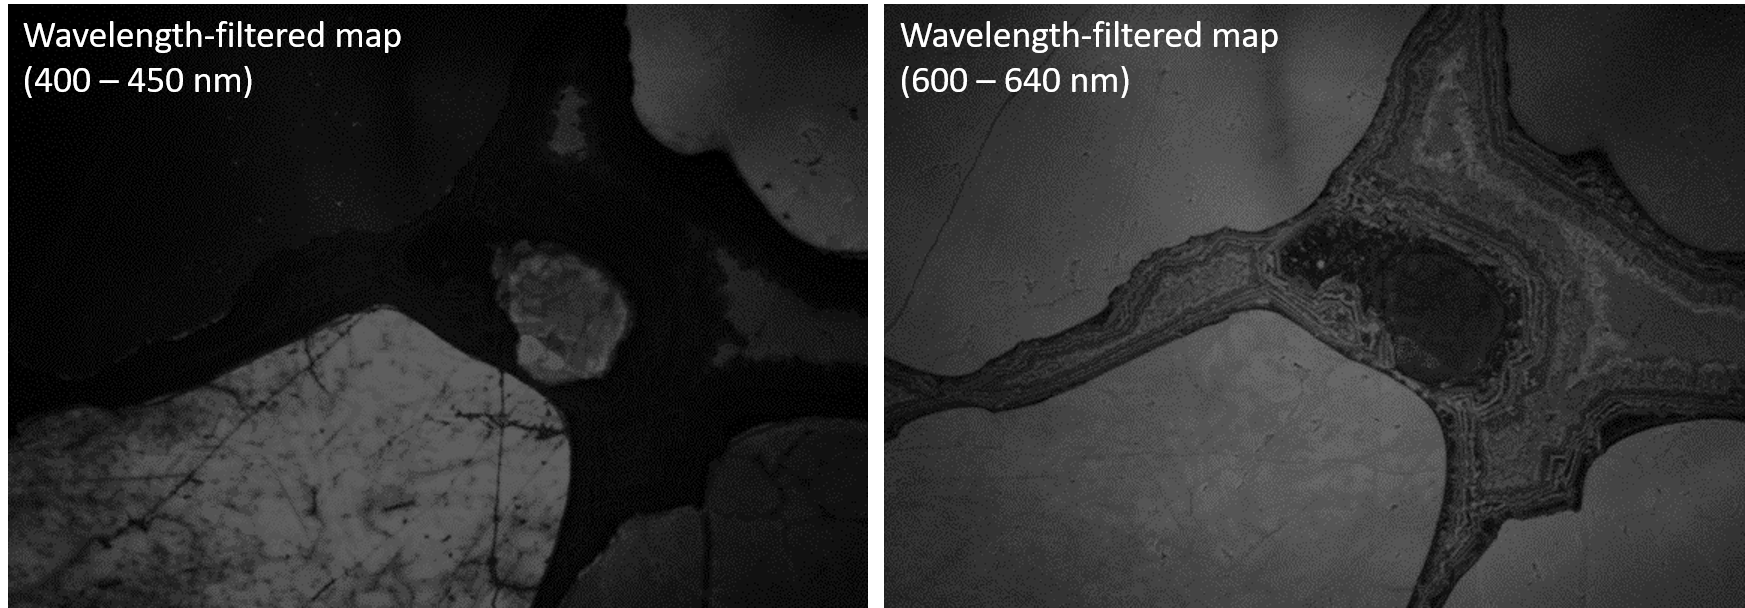
Wavelength-filtered map: The electron beam is scanned across the specimen surface, and the wavelength-filtered signal is recorded at each location and displayed as a (2D) map. More than one wavelength-filtered map may be recorded from the same specimen region. Typically, a user defines two (or more) wavelength ranges, enabling the spatial distribution of emission centers to be discriminated against.
 Color map: A unique form of wavelength-filtered mapping captures three discrete wavelength bands corresponding to the visible spectrum's red, green, and blue components. The three components are recombined to form a color image in much the same way as the viewing screen of a color television. Some specialized detectors, such as the ChromaCL2™ detector, capture the color components simultaneously, enabling color images to be captured in a single electron beam pass. More typically, sequential scans of the electron beam are required, with the user changing the color component detected between scans of the electron beam.
Wavelength-filtered spectrum image: A spatially and spectrally resolved (3D) hyperspectral data cube is captured by collecting a series of (aligned) wavelength-filtered maps.
In this acquisition mode, a PMT detector collects n wavelength-filtered CL images whose pixel time in each image slice can be collected thousands of times faster than an array detector used in the wavelength-resolved approach. Spectrum images with 167 wavelength channels may be collected up to 30x quicker.
Uses
Discriminate materials by composition and/or crystal structure, reveal the purity of semiconductor materials and determine resonance modes in nanophotonic materials.
|
|
|
| Determining photonic band structure by energy-momentum spectroscopy in an electron microscope | Cathodoluminescence techniques for the geosciences |
Angle-Resolved
Overview
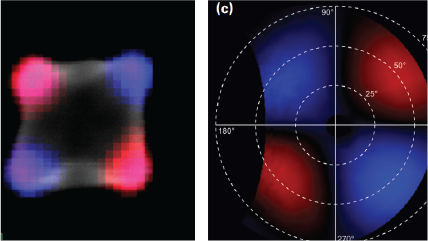
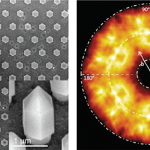
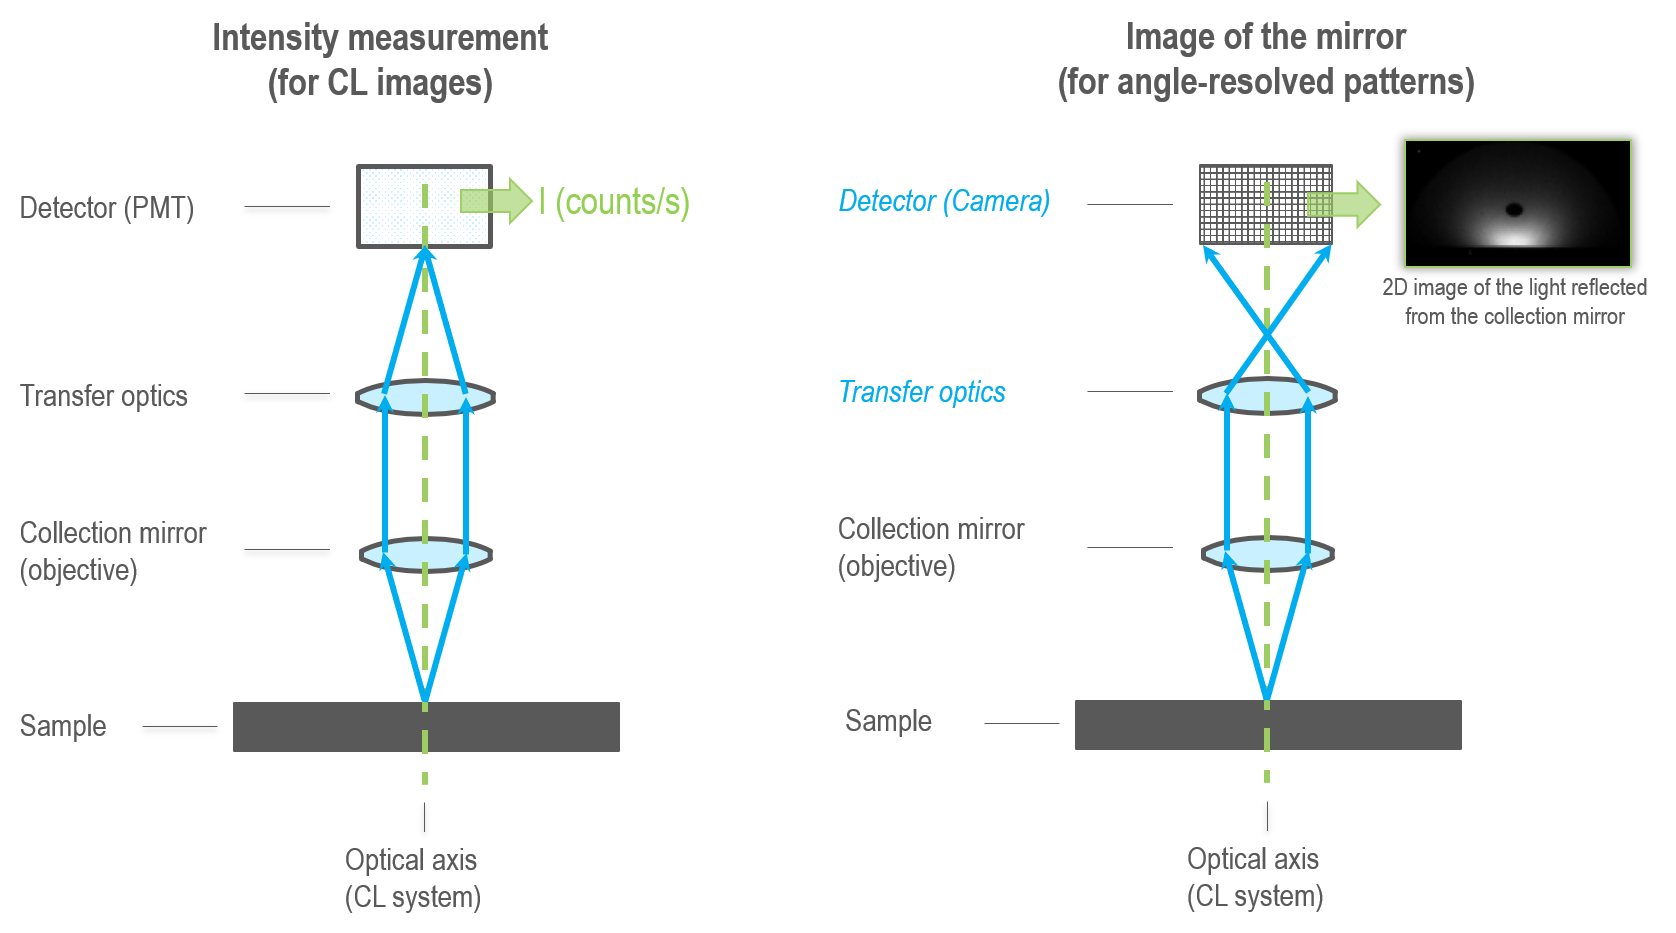
 In the angle-resolved cathodoluminescence (ARCL) mode, the direction in which a photon is emitted is determined. An objective lens or, more commonly, a collection mirror projects an image of the emitted light onto a pixelated detector, e.g., a camera. When an appropriate optical system is used, each pixel in the captured image corresponds to a unique emission direction from the specimen. The raw image is typically transformed into polar coordinates for display and interpretation.
The result of an angle-resolved measurement contains no wavelength or polarization information unless additional dispersion filtering is used (e.g., wavelength—and angle-resolved mode).
Angle-filtered information may be captured using an iris or a pinhole to select a specific (range of) angle(s). However, this particular acquisition mode's low resolution and highly serial naturehave limited its usefulness.
Sometimes referred to as Fourier imaging or momentum spectroscopy.
Data collection
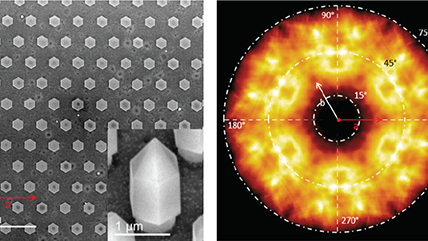
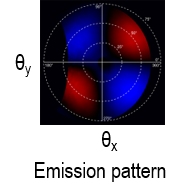 Emission pattern or angle-resolved emission pattern: The emission pattern is a plot of the direction in which photons are emitted from a specimen. It is typically presented in polar coordinates, where the emission direction is described by the azimuthal and zenith angles. A single emission pattern may be captured from a point or region of the sample exposed to the electron beam of the electron microscope.
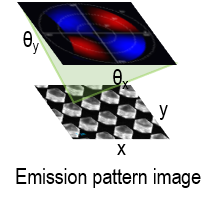 Emission pattern image or angle-resolved spectrum image: The electron beam is scanned across the specimen surface, and an emission pattern is recorded at each location, creating a hyperspectral (4D) data construct.
Uses
|
|
Investigating the optical properties of nanophotonic materials far below the diffraction limit |
Polarization
Overview
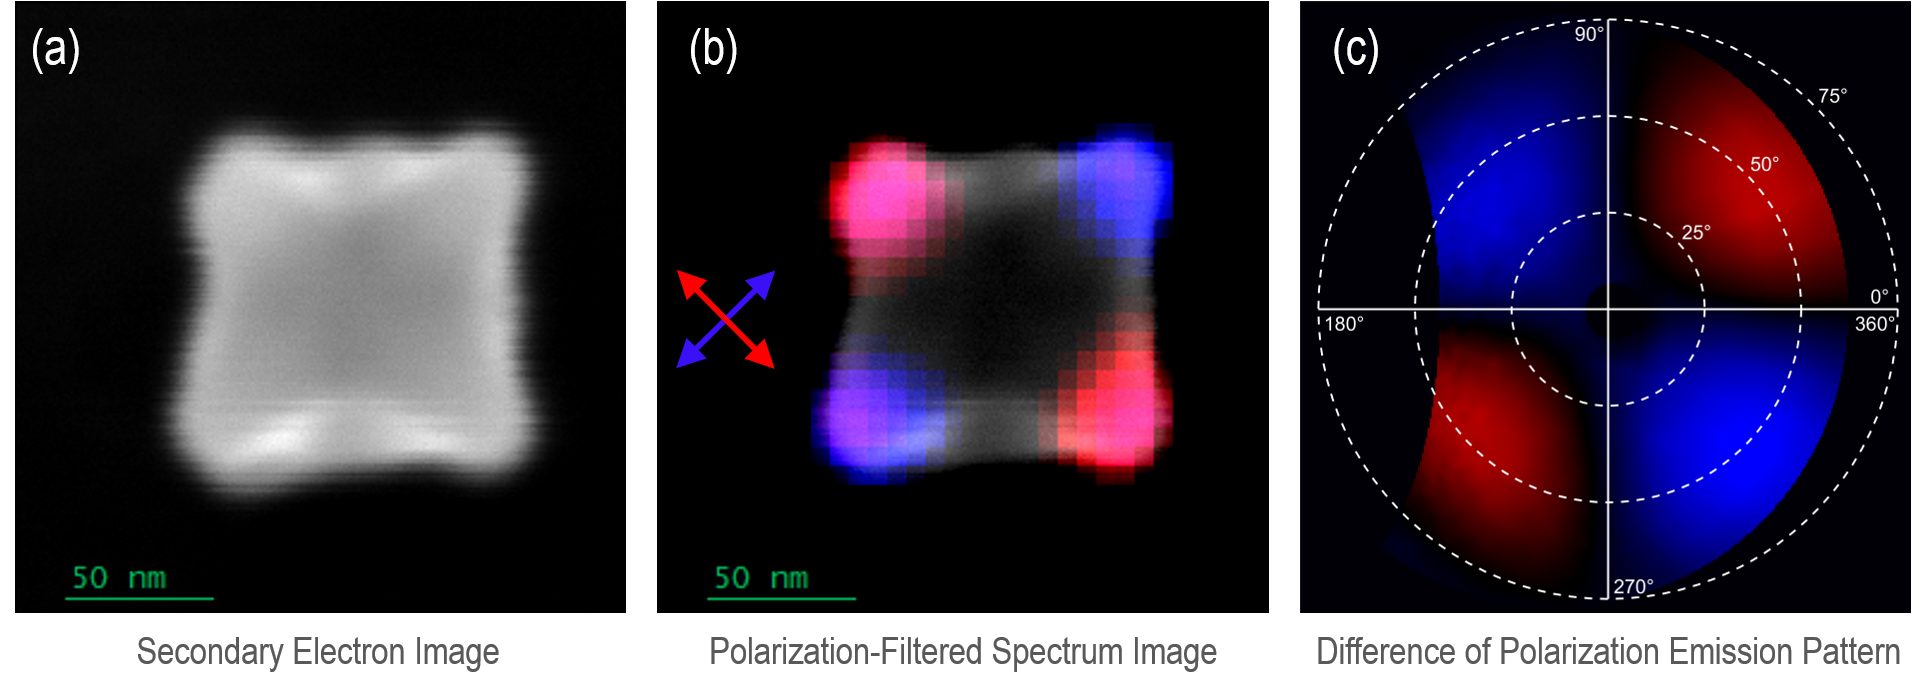
Light is a transverse electromagnetic wave. The electric and magnetic fields that compose the light wave constantly oscillate transversely to the propagation direction; the polarization describes the direction in which these electromagnetic fields oscillate.
A polarization analyzer can be incorporated into the optical chain of another cathodoluminescence (CL) mode to provide polarization-filtered or polarization-resolved data, such as a polarization- and wavelength-filtered map or a polarization- and angle-resolved emission pattern (polarimetry).
Data collection
Polarization filtered: The polarization analyzer consists of a linear polarizer with a user-defined orientation.
Polarization-resolved: The polarization analyzer consists of a quarter-wave plate and linear polarizer. When images are captured over six different analyzer settings, the Stokes parameters that describe the full polarization state of the emitted light may be retrieved.
Uses
Polarization plays a key role in light-matter interactions and helps study coherence, scattering, birefringence, and chirality, finding wide applications in nanophotonic applications. More recently, the degree of polarization has been used to characterize strain in single-crystal semiconductors and insulators. While in (multi-crystalline) samples such as meteorite thin sections, the polarization of the emitted light has also been used to reveal crystal orientation and mineral texture.
Experiment briefs and application notes
Time-Resolved
Overview
Time-resolved cathodoluminescence (CL) experiments record how the CL signal varies with time. The signal may be from any of the modes of operation but is more typically restricted to the wavelength-filtered intensity or wavelength spectrum.
The term time-resolved covers a very broad range of time domains extending from several minutes or hours, such as in experiments that monitor the impact of electron beam exposure on the sample, to picoseconds where the dynamics of excitons and free carriers in semiconductors are analyzed.
Wavelength- and Angle-Resolved
Overview
 Wavelength- and angle-resolved cathodoluminescence (WARCL) mode enables spectroscopic analysis of a sample's emission pattern. The data is collected as a 3D data cube (λ, θ, Φ) and can be considered a stack of wavelength-filtered emission patterns or a (wavelength) spectrum recorded in every emission direction.
It was sometimes referred to as energy-momentum spectroscopy.
Data collection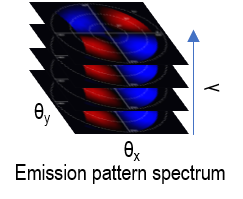
Data collection utilizes an angle-selecting slit to select a portion of the angle space before using an imaging spectrograph to disperse by wavelength. Commonly, for higher spatial and spectral resolutions, the angular range is scanned sequentially to reconstruct the data cube (λ, θ, Φ).
Uses
To understand how light and matter interact down to the nanoscale, it is important to understand the wavelength distribution (color) of light-emitting devices as a function of viewing angle and determine energy-momentum diagrams of photonic samples.
An emission pattern spectrum from a micro-LED array reveals distinct emission patterns to be observed at each wavelength; the data has been colorized according to the wavelength. The static images show the emission pattern at each corresponding color, and the video represents the entire dataset, which consists of emission patterns recorded at 1340 wavelengths across the visible spectrum.
 |
Determining photonic band structure by energy-momentum spectroscopy in an electron microscope |