Wavelength-Resolved
Overview
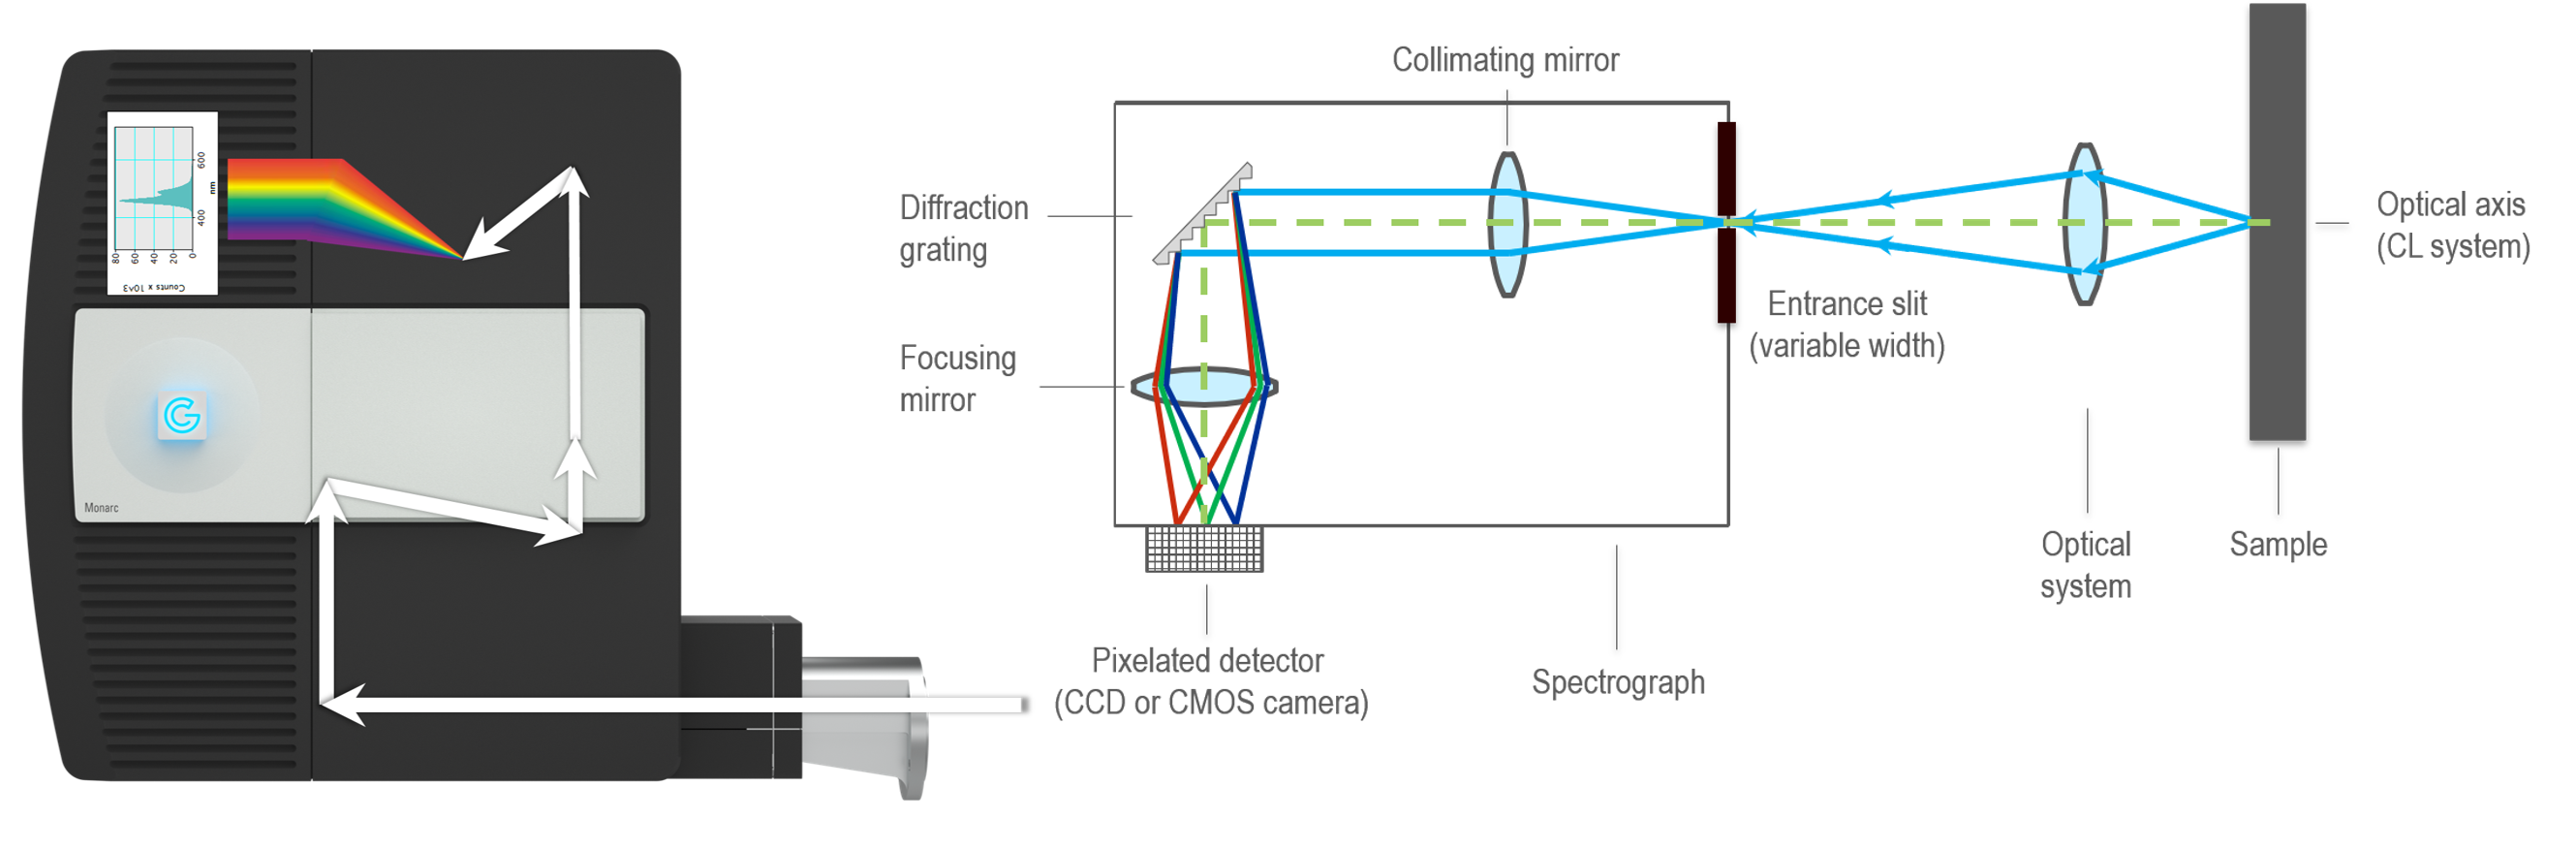
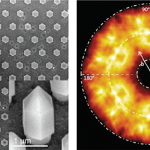
In wavelength-resolved mode, the wavelength distribution of the emitted light is analyzed. Light collected from the specimen is focused onto the entrance slit of a spectrograph that disperses light by wavelength (energy) using a pixelated detector to record a wavelength spectrum—a histogram displaying the intensity of light by wavelength.
Sometimes referred to as hyperspectral cathodoluminescence analysis or wavelength imaging.
Data collection
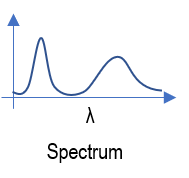 Wavelength-resolved spectrum: The wavelength distribution of emitted light is recorded from a point or region of the sample exposed to the electron beam of the electron microscope. One-dimensional data is displayed by plotting a histogram of count rate (intensity) versus wavelength or energy—wavelength and energy being inversely proportional.
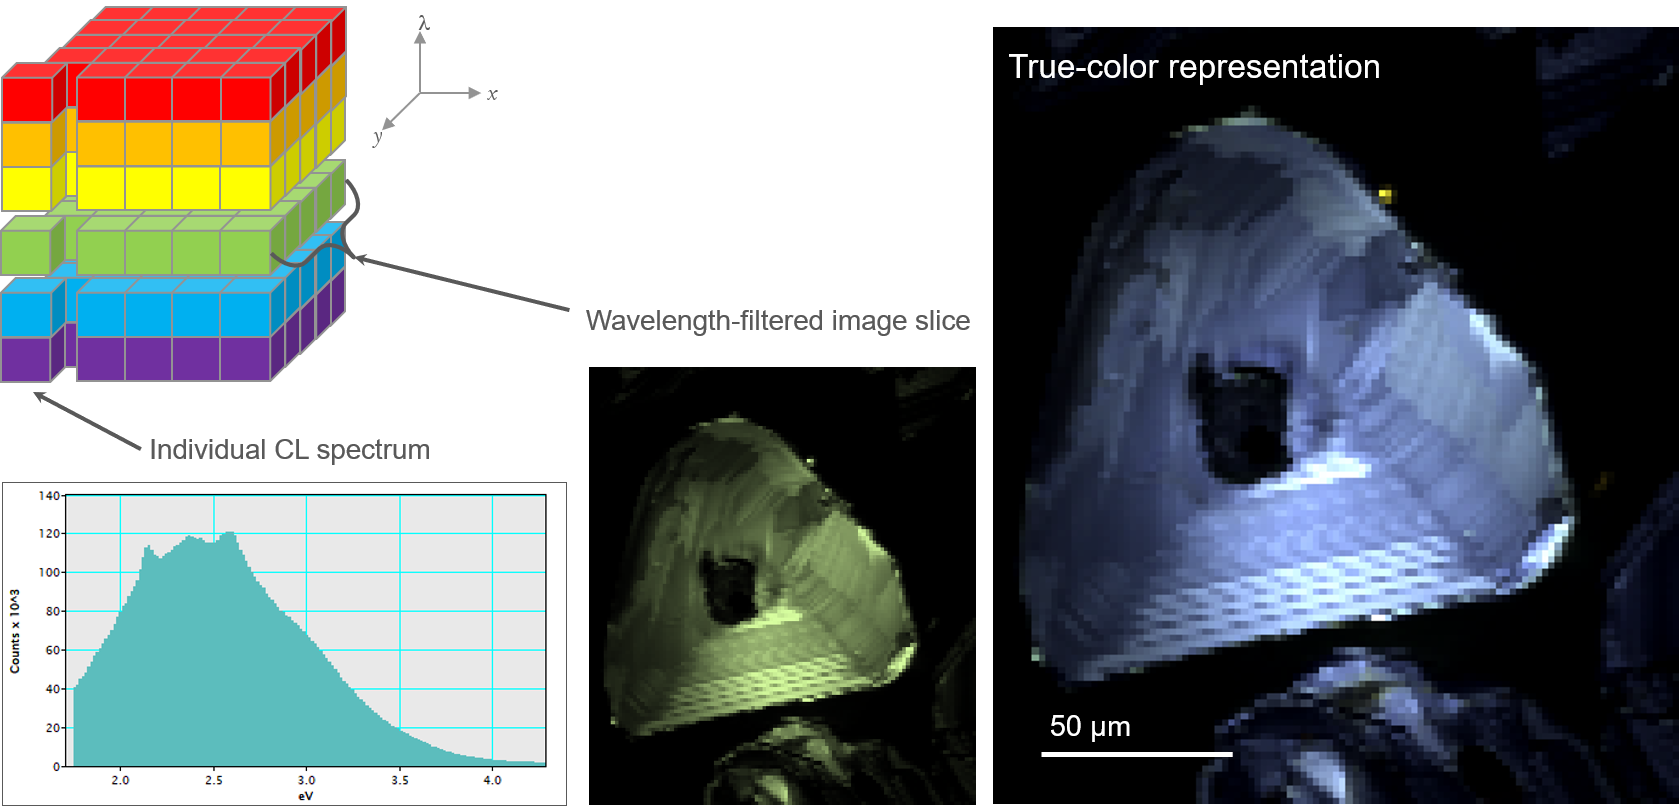
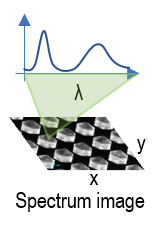 Wavelength-resolved spectrum image: The electron beam is scanned across the specimen surface in a pre-defined pattern, and a wavelength-resolved spectrum is recorded at each location, creating hyperspectral (3D) data.
Uses
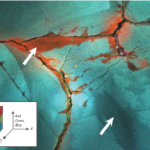
Identify compounds and phases, determine the electronic structure, reveal and determine trace elements, and map composition and/or stress.
 |
 |
| Determining photonic band structure by energy-momentum spectroscopy in an electron microscope | Cathodoluminescence techniques for the geosciences |