Wavelength-Filtered SI
In the scanning (SEM) and scanning transmission electron microscope (STEM) mode in a TEM, the electron beam is focused on a small probe and rastered to acquire spatial information in a serial manner (X, Y). In the wavelength-filtered spectrum image (SI) mode, it collects the wavelength information (λ) serially, e.g., captures a series of (aligned) wavelength-filtered maps over a defined spectral range (or ranges).
A typical workflow includes:
-
Set up the microscope in scanning mode and in the appropriate spectrometer state (TEM only).
-
Ensure that the region of interest is viewable within a DigiScan™ survey image.
-
Define the wavelength range and sampling rate to collect the SI.
-
In the Scan Setup dialog, specify which signals you want to acquire.
-
In the Scan Setup dialog, specify your desired pixel density and dwell time.
-
Select Capture on the Wavelength Filtered SI palette.
Here are detailed SI workflows you can follow to better understand your sample when you use DigitalMicrograph® software.
Wavelength Filtered SI setup
Microscope setup (TEM only)
 Set up the microscope in scanning mode. Refer to your microscope manufacturer's user manual for details.
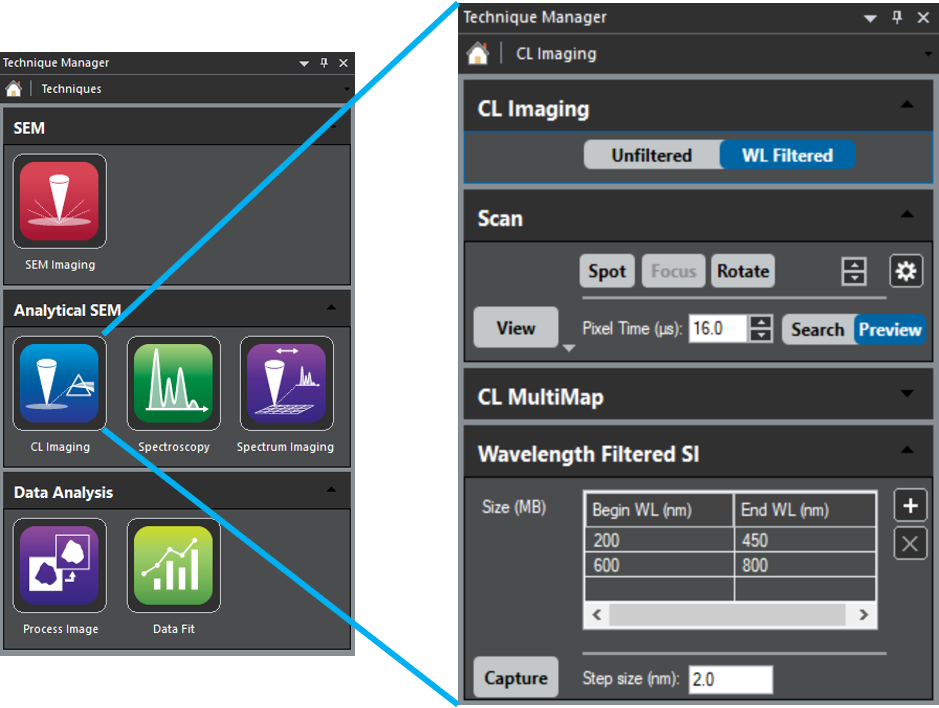
Within the DigitalMicrograph software, go to the CL Imaging technique, then open the palettes you require for the experiment:
-
CL Imaging – Controls the CL spectrometer
-
Scan – Defines setting for the DigiScan system
-
Wavelength Filtered SI – Adjusts the wavelength range and sampling
CL Imaging
Select WL Filtered mode to designate and enable the wavelength-filtered functionality.
Scan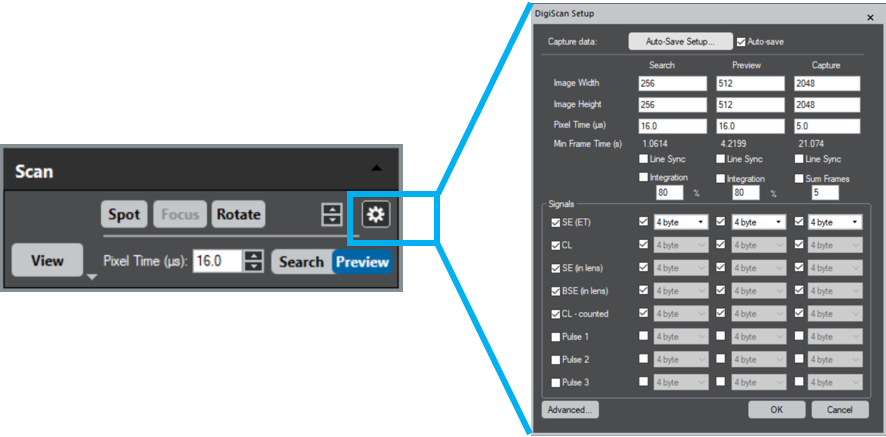
Select the Setup icon to access the DigiScan Setup dialog and define the signal parameters you want to collect, including the image width and height (pixels) and pixel time of the individual wavelength-filtered images. We recommend capturing at least one more signal than the CL signal.
Wavelength-filtered SI
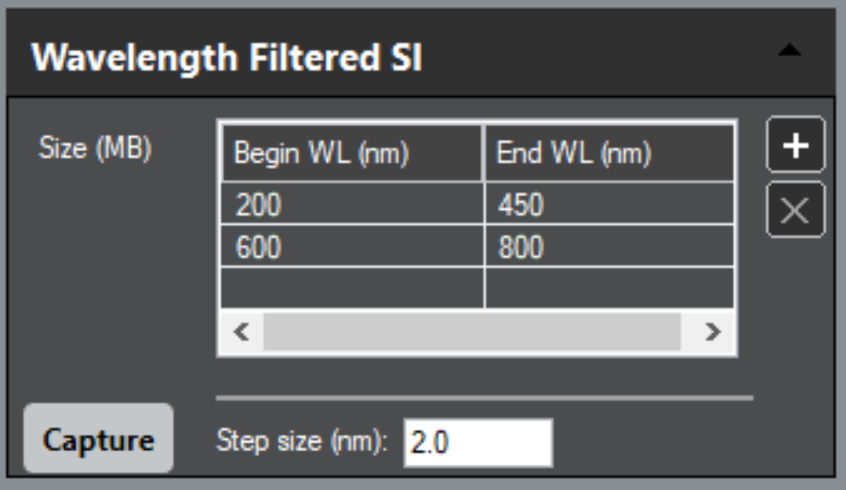 Define one or more wavelength ranges by entering the Begin WL (nm) and End WL (nm) wavelengths into the table. Enter the values by selecting the + icon and completing the dialog. You may edit entries in the table by double-clicking on a value and overwriting the entry. You can highlight a row and then select the X icon to delete the entry.
Flow control
Start/Stop
Once the SI acquisition parameters are set up, select the Capture button on the Wavelength Filtered SI palette to start the acquisition.
Once selected, the SI acquisition routine will take control of the microscope beam and begin the acquisition. During acquisition, the Capture button pulses in blue to indicate that an acquisition is in progress. In this state, a subsequent click of the Capture button halts the acquisition. While the acquisition proceeds, DigitalMicrograph displays a new workspace and fills it with image stacks for each DigiScan signal you request.
Note: During active SI acquisition, the spectrometers are unavailable for single-spectrum acquisition.
You can monitor how the acquisition is proceeding using the Visual Feedback provided. Each SI is displayed in a new image window, which fills as the acquisition proceeds. If at any point you wish to halt the acquisition, click on the pulsing Capture button. When the acquisition halts or completes, the beam control returns to the Beam Safe Point (if one is defined) or returns to the microscope.
After the acquisition
We recommend you immediately save all data before analyzing and/or removing artifacts.
Artifact removal
Drift
By using the Image Processing technique, you can calculate and eliminate inter-frame drift from the data cube. Specifically, you can use the Image Alignment palette to align a series of images to one another or to images in another series. This is an essential step before analyzing wavelength-filtered SIs.
The image alignment process and drift removal are documented in the help files of DigitalMicrograph software.
Spectrum Image analysis
For more details on the analysis of the spectrum image data cubes collected by wavelength-filtered spectrum imaging please refer to the Analyze section, particularly the linear least squares fitting discussion.