Wavelength/Angle-Resolved SI
The spectrum imaging (SI) technique is useful for collecting either wavelength-resolved spectrum images or (angle-resolved) emission pattern images.
The electron beam is focused into a small probe and rastered to acquire spatial information in a serial manner (X, Y). In SI acquisition mode, you acquire a spectrum (or emission pattern) at each pixel position, hence building up the spectrum image on a spectrum-by-spectrum or emission pattern-by-emission pattern basis. A typical workflow includes:
-
Set up the microscope in scanning mode and in the appropriate state for the spectrometer you wish to use.
-
Use the DigiScan™ system to acquire and assign a survey image.
-
Create a spectrum image survey region of interest on the survey image.
-
View the spectrum/emission pattern from the region where you wish to acquire the spectrum image.
-
In the SI Setup dialog, specify which spectrum signals you want to acquire.
-
If artifact corrections are required, enable them and/or create the artifact correction survey regions of interest.
-
In the Spectrum Image dialog, specify the pixel dwell time you want to use and the size of the spectrum image in pixels.
-
Select Start on the Spectrum Imaging dialog.
Here are detailed SI workflows you can follow to better understand your sample when you use DigitalMicrograph® software.
SEM/STEM SI Setup
Microscope setup (TEM only)
Set up the microscope in scanning mode. Refer to your microscope manufacturer's user manual for details.
Configure the spectrum imaging technique
 Within the DigitalMicrograph® software, go to the Spectrum Imaging or STEM SI technique, then open the palettes you require for the experiment:
- Scan – Controls the DigiScan™ system
- SI Acquisition or STEM SI – Defines the spectrum imaging (SI) acquisition
- Relevant signal acquisition palettes for each available signal
- Additional data analysis palettes for the available signals
SI Acquisition or STEM SI palette
 The SI Acquisition and STEM SI palettes enable the setup and control of your SI experiment on the SEM and TEM, respectively. If no STEM SI experiment is currently set up, the palette appears in a mode selection state. Brief descriptions of the dialog features are given below.
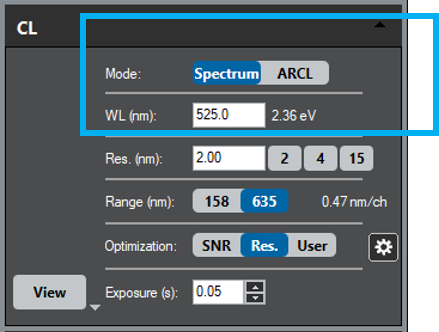
In some models of the Monarc® system, more than one acquisition mode is available within the SI workflow. In the CL palette, select the Spectrum or ARCL mode to collect a (wavelength) spectroscopy SI or an angle-resolved SI, respectively.
Signal selection
 The top section of the palette features a button for each available signal in the SI experiment (e.g., CL, EDS, EELS, and CBED) and an icon to allow simultaneous capture of other DigiScan signals (e.g., SE-BSE). For each signal selected, the appropriate acquisition palette automatically expands or collapses and may trigger requests to change the microscope state as necessary. At least one signal (besides the Scan button) must be selected, or the SI experiment cannot start.
Note: Some signals are mutually exclusive. Selecting such a signal will automatically deselect the other.
Mode selection
Use the palette's bottom section to set up the spatial coordinates of the SI. Pressing a mode button (2D Array, Line Scan, Multi-Point, and Time Series) will automatically assign a suitable survey image and create a default SI survey region of interest (ROI) marker. A Preview type acquisition is automatically started and assigned if no suitable image is available.
- 2D Array – Regular 2D SI that consists of an array of equally spaced points in X and Y
- Line Scan – 1D SI that includes an array of equally spaced points along a line
- Multi-Point – Acquires a set of point spectra with identical parameters from individual spatial positions and collects them into a 1D SI data container
- Time Series – Sequentially acquires a set of spectra with identical parameters from the identical sample area and collects them in a 1D SI data container
After choosing your signal and mode, a new palette is available. The palette includes:
- Capture – Starts a new SI acquisition using the specified parameters
- Pixel Time (s) – Specifies the beam's pixel dwell time and applies it to all spectral acquisition with the permitted values restricted to the minimum and maximum readout times of the selected detectors
Note: The acquisition time estimate automatically updates when you change the dwell time.
- Live – Activates (blue) or deactivates (gray) live data display during SI acquisition
- Drift – Activates (blue) or deactivates (gray) spatial drift correction
 The bottom parameters (boxed-in portion of the image) dictate the specific modes of capture per the selection made in the STEM SI palette. The options available are dependent on the mode that was selected there; the options include:
2D Array
- Size – Specify the size of the SI in pixels by using the Width and Height fields
The size automatically updates if you change the SI survey ROI position on the active survey image. Changing the Width value automatically adjusts the sampling resolution while keeping the acquired region the same. A change in Height changes the aspect ratio and, hence, the acquired region of the SI while keeping the sampling resolution identical.
Note: The acquisition time estimate automatically updates when the size is changed.
Line Scan
 Size – Specify the line scan Length in pixels
The sampling resolution automatically updates when the size is changed. Step displays the current sampling resolution in calibrated units. The SI size in pixels updates automatically when the sampling resolution changes, keeping the acquired scan length identical.
- Average dose – Enables the averaged line scan functionality and is not available for all systems and settings
Multi-Point
 No. positions – Allows you to specify the SI size in the number of individual positions
The number of survey ROI point markers is updated accordingly.
Note: You need to specify at least 2 points before the SI acquisition can start.
- Arrange position – Click these buttons to arrange (selected) positions in various ways over the field of view
Time Series
 Repeats – Allows you to specify the SI size in the number of individual acquisitions
Note: You need to specify at least 2 repeats before the SI acquisition can start.
- Delay (s) – Where you specify a pause in between two successive acquisitions
During these pauses, the signal controllers stop, and the beam control releases to the default. The acquisition is then in an idle state similar to a paused acquisition, but it displays a countdown at the bottom of the STEM SI palette. The next spectrum is automatically started at the end of the countdown acquisition.
- 2D Scan – If left unchecked, the spectra will be acquired from a stationary position as indicated by an ROI point marker in the survey image
If checked, it acquires spectra rapidly and repeatedly scans a specified area. The ROI rectangle represents the area in the survey image, and the two fields below the checkbox define sampling for this area. Enter values to change the area size or use the up and down arrows to change the sampling density of the area.
Survey Image
Each spectrum image acquisition requires a survey image. It provides a frame of reference and a useful reminder of where the data was acquired. You can only assign one image at a time as the active survey image. This image should have been recently acquired and be of good quality. Images acquired with too short a pixel dwell time can result in inaccurate beam positioning and a mismatch of indicated and acquired spectrum image position. The survey image can be either a recently acquired (static) image or a still continuously acquiring image. For a beam-sensitive specimen, a recently acquired image might work better. A continuously acquired image can be beneficial in avoiding charge-induced specimen drift at high magnification and provide the most accurate survey image at the start of spectrum image acquisition.
Collect and assign a survey image
-
Locate the region of the sample you are interested in.
-
 Collect an image.
Use a dwell time of 16 μs/pixel or longer. The long dwell time ensures an accurate microscope beam position in subsequent analysis. Ensure that the region you wish to acquire is smaller than the field of view, typically about one-third of the size. This allows the beam deflectors to correct for spatial drift and ensures that the spectrum image (SI) region is well represented in the survey image.
- Select an SI mode or use the survey region of interest (ROI) tool from the floating menus over the image.
Either action automatically assigns the frontmost image as the survey image. The window title changes to remind you that this is now the current survey image.
- Refresh the survey image.
The current survey image is automatically de-assigned when a different survey image is selected. If you close an active survey image or remove all survey ROIs, the STEM SI palette reverts to the mode selection state.
When an SI is acquired, it creates a copy of the survey image on the SI data workspace. This image acts as a data reference, which means the survey ROI can no longer be moved or resized. Only the survey image on the View workspace is actively and interactively linked to the SI palette.
Select and Survey ROI
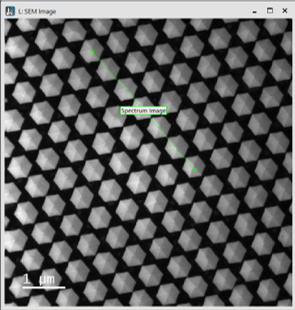
For a spectrum image (SI) acquisition, allocating a region on the survey image for acquisition is necessary. A green region of interest (ROI) marker identifies these regions. The type of the SI marker depends on the SI mode and can be either point, line, or rectangle ROIs. You can position, resize, and remove the survey ROI like any other ROI marker.
- Add a survey ROI by selecting a SI mode.
If the SI palette is in a mode selection state, selecting any mode automatically adds the appropriate survey ROI to the survey image, which is also automatically assigned by this action. The position and size are the same as the one used for the last SI acquisition of that type.
- Add a survey ROI by using the floating menu.
When you right-click a recent image on the View workspace, the SI ROI tool in the floating menu appears. This drop-down menu allows you to select the SI type. This tool can create the survey ROI directly on the image. Then, the image is automatically assigned as a survey image while the spectrum imaging mode is adjusted. Other, now obsolete survey ROIs are automatically removed.
Note: For Multi-Point, keep the Shift key pressed while adding a point to keep the tool active and allow the selection of multiple points in a series of clicks.
- Remove a survey ROI.
Click the ROI marker with the mouse while you press the Delete key on the keyboard. If you remove all survey ROIs from the current SI mode, the STEM-SI palette automatically reverts to the mode selection state.
Survey ROI types
2D Array
 A regular 2D SI consists of an array of equally spaced points in X and Y. It is represented as a single, rectangle ROI in the survey image.
Resizing the survey ROI keeps the total number of pixels and the total acquisition time constant. When you resize the ROI, the SI size in pixels and the sampling resolution change automatically.
The survey ROI snaps to positions of the appropriate size and aspect ratio. The smaller the total number of pixels in the SI, the rougher those snaps may appear.
Line Scan
 A one-dimensional (1D) SI consists of an array of equally spaced points along a line. It is represented as a single, line ROI in the survey image. A yellow cross indicates the start position of the scan. If the averaging option is enabled, the cross is replaced by a yellow line that indicates the averaging direction and width.
Resizing the green survey ROI adjusts the sampling resolution but keeps the number of sampled points constant. Changing the dimensions of the yellow survey ROI adjusts the averaging width but keeps the number of sampling points along that direction constant. You can adjust the averaging direction angle by pressing the Ctrl key down while you drag the green handle of the yellow survey ROI. Deleting the yellow survey ROI will switch the averaging option off.
Multipoint
A set of point spectra acquired with identical parameters from individual spatial positions collected in a 1D SI data container. Each point is represented by a single ROI, a single, numbered point in the survey image. This number specifies the spectrum position within the SI data container.
Adding points from the floating menu using the SI ROI tool is most convenient. Holding the Shift key allows you to add multiple points in a series of mouse clicks. You can remove individual points by selecting them and pressing the Delete key. Once deleted, the remaining points are automatically renumbered.
Click the Arrange points buttons to arrange the selected set of points or, if none are selected, all points. If a rectangular ROI is selected, the points are arranged within this area. Otherwise, they are arranged over the entire survey image.


Time Series
A set of spectra sequentially acquired with identical parameters from the identical sample area collected in a 1D SI data container. The sample position is represented by a point ROI for stationary acquisition or a rectangular ROI if the 2D Scan option is enabled.
Resizing the 2D Scan area is restricted by the number of sampling points of the scan, which is limited by the SI Pixel Time. Slower scans allow higher sampling. To access a larger scan area, it can be necessary to either reduce sampling with the spin controls for the 2D Scan fields and/or increase the Pixel Time.
Flow Control
Start/Stop
Once the spectrum image (SI) acquisition parameters and any artifact corrections are set up, select the Capture button on the SI palette to start an acquisition. If you wish to update the survey image before proceeding with acquisition, right-click on it and select Restart scan from the context menu.
Once started, the SI acquisition routine will control the microscope beam, and the acquisition will then begin. During acquisition, the Capture button pulses in blue to indicate that an acquisition is active and that a subsequent click of the Capture button halts the acquisition. A new workspace is created and filled with a copy of the survey image and data containers for all acquired signals.
Note: During active SI acquisition, the spectrometers are unavailable for single-spectrum acquisition.
If spatial drift correction is enabled, some preliminary measurements are performed. Depending on the preferences specified, visual feedback on the measurements may be provided.
You can monitor how the acquisition is proceeding using the visual feedback provided. Each SI is displayed in a new image window, which fills as the acquisition proceeds. Live spectra may also be shown or hidden as desired. If you wish to halt the acquisition, click the pulsing Capture button. When the acquisition is halted or completed, the beam control returns to the Beam Safe Point (if one has been set up), or alternatively, it is returned to the microscope.
Pause/Resume
During an SI acquisition, performing a microscope adjustment that temporarily degrades the data collected by the spectrometer may become necessary. At such times, you should pause the acquisition, adjust, and resume after conditions have stabilized. To pause the acquisition at any time, click on the pulsing Capture button in the STEM-SI palette while keeping the Alt key pressed at the same time—the label of the Capture button changes to Resume.
When you pause the acquisition, the beam either moves to the Beam Safe Point (if you defined one) or returns otherwise beam control to the microscope. If the acquisition is paused and restarted, the software immediately carries out spatial drift corrections if you enable Apply on Resume from Pause before acquiring data from where it was before the pause.
To resume acquisition from the paused state, click the Resume button. To stop acquisition from the paused state, click on the Resume button while pressing the Alt key at the same time.
Note: Pausing is not available for hardware-synchronized acquisitions. On systems that, by default, use hardware synchronized acquisition, you can force software synchronization via the Setup dialog.
After the acquisition
All experimental data is saved immediately using the current SI group saving options if the autosave functionality is enabled. If the close column values after acquisition option is enabled, the microscope column valves are closed (on systems that support column valve access). You can use the (still) active survey image on the View workspace to immediately restart an identical or similar acquisition after adjusting survey ROIs and parameters.
Visual Feedback
Spectrum image display
During spectrum image (SI) acquisition, each SI is shown in its own image display. The spectrum image fills as the spectral data is acquired and placed into position in the SI. You can use the 3D visualization tools to explore the spectral data while the acquisition is running (e.g., the Slice tool). Since a processing overhead may introduce artifacts into your data acquisition, we advise doing this after acquisition or while paused.
Live spectra
Live spectral feedback during acquisition can be enabled or disabled with the Live button in the STEM-SI palette. You can manipulate the live spectra using standard line plot display visualization tools.

Beam position cursor
During acquisition, an orange beam cursor marks the beam position on the survey image. This indicates the progress of the acquisition, and its position may vary slightly from that of the beam. For particularly fast acquisitions, the cursor is displayed as a line or even completely disabled.
Pixels per second
![]() The actual SI acquisition rate is posted to the DigitalMicrograph® software status area at the bottom of the application. It displays in units of pixels per second. This information can be useful when configuring a spectrometer for optimal readout speed.
The actual SI acquisition rate is posted to the DigitalMicrograph® software status area at the bottom of the application. It displays in units of pixels per second. This information can be useful when configuring a spectrometer for optimal readout speed.
Time remaining
The remaining acquisition time is displayed in real-time in the STEM-SI palette above the Capture button. This time is based on the actual acquisition rate, excluding any pauses.
Adjustments
Spatial drift correction
Thermal effects and mechanical instabilities in the microscope can cause the sample to drift under the electron beam. Since acquiring a spectrum image (SI) can occur over a considerable period, this drift could easily cause features to smear in the SI. Indeed, SI acquired over a long time at high magnification may contain data from a much different sample region than desired. Spatial drift is worse at higher magnifications and varies from one microscope to another and even from one microscope session to another.
Spatial drift correction entails cross-correlation of a reference region with a new scan of the same region taken periodically throughout the SI acquisition. The cross-correlation process works better if this spatial drift region has some unique spatial structure.
First, a region is defined to perform a reference scan on the survey image. At the start of the SI acquisition, the first drift measurement scan from the same region is taken and corrected for any spatial drift. The scan resolution and pixel dwell time used for the spatial drift scans are the same as for the survey image. Cross-correlation measures drift; thus, the correction is applied as an offset to the beam scan coordinates. When you take a measurement, the data posts to the DigitalMicrograph® software results window. If the survey image is calibrated, it quotes any shift in calibrated units. During acquisition, the drift measurement repeats periodically using the specified frequency. After the acquisition, you can view the drift measurement using the Show correction menu item in the SI menu.
Note: Since the drift image is acquired during the SI acquisition, the detector must not interfere with the spectrum acquisition when inserted.
Set up for spatial drift correction
- Acquire a survey image and assign it for the SI acquisition.
- Activate the Drift button on the STEM-SI palette.
A rectangular region of interest (ROI) marker labeled Spatial Drift is shown on the survey image, indicating the measurement area for drift correction.
- Adjust and accept the correction frequency settings.
 The optimum frequency of corrections depends on the magnitude of the drift. It is a compromise between keeping the total acquisition time short and getting clean SI data. Choosing a drift correction frequency based on spatial features (pixels, rows, frames) generally gives a more pleasing result than the time-based settings.
- Adjust the Spatial Drift ROI.
 Use the mouse to resize and move the ROI to an appropriate location. The measurement area should be at least twice as big as the maximum drift expected between two subsequent measurements. It should contain an easily recognizable feature of sufficient contrast. Ideally, the area should not overlap with the data acquisition area.
- Adjust the advanced drift correction options (if needed).
Click the Drift button while pressing the Alt key to directly access the drift correction options page of the Spectrum Imaging Setup dialog.
Viewing point spectra
When configuring the various spectrometers for SI acquisition (e.g., determining the optimum pixel dwell time for acquisition), acquiring a continuous spectrum from a region in the survey image is often desirable. The microscope beam can be placed anywhere within the survey image using the Spot functionality so you can view the spectrum from each spectrometer at that position.

To view the spectrum at a particular point:
-
Acquire and assign a survey image.
-
Enable the Spot button in the Scan palette.
A cursor labeled Beam appears on the survey image. If the survey image is currently acquired, the marker is labeled Park instead. In this case, stop the acquisition to get a stationary beam.
-
Start a continuous acquisition from the spectrometer(s) of interest using the View button of the respective Spectral Acquisition palette – The spectrum acquisition appears in a new line plot image display.
-
Drag the beam cursor around to view the spectrum at various points.
The spectrum display continues to display data from the spectrometer as the spot marker tool moves around. Use this mode to establish the optimal acquisition parameters for SI acquisition.
Beam safe point
 When the acquisition is paused or has finished, an attempt is made to minimize possible beam damage to the specimen. The beam either moves to the park point (if you have defined one) or the beam control returns to the microscope.
Note: The point is labeled Park during an active scan. This label name changes to Beam while no scan is active and the beam is stationary at the indicated location.
To set up a safe point:
-
Ensure a survey image is assigned.
-
Enable the Spot mode on the Scan palette, and position the beam cursor at the safe point – A region in the vacuum is ideal.
-
If the SI acquisition pauses, or when the acquisition terminates, the beam returns to this point.