Select and Survey ROI
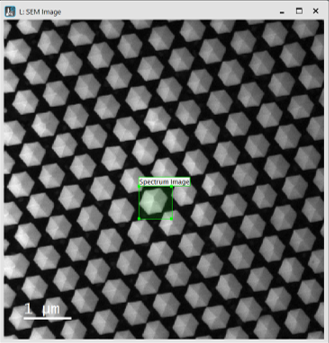
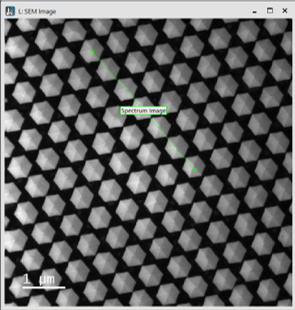
For a spectrum image (SI) acquisition, allocating a region on the survey image for acquisition is necessary. A green region of interest (ROI) marker identifies these regions. The type of the SI marker depends on the SI mode and can be either point, line, or rectangle ROIs. You can position, resize, and remove the survey ROI like any other ROI marker.
- Add a survey ROI by selecting a SI mode.
If the SI palette is in a mode selection state, selecting any mode automatically adds the appropriate survey ROI to the survey image, which is also automatically assigned by this action. The position and size are the same as the one used for the last SI acquisition of that type.
- Add a survey ROI by using the floating menu.
When you right-click a recent image on the View workspace, the SI ROI tool in the floating menu appears. This drop-down menu allows you to select the SI type. This tool can create the survey ROI directly on the image. Then, the image is automatically assigned as a survey image while the spectrum imaging mode is adjusted. Other, now obsolete survey ROIs are automatically removed.
Note: For Multi-Point, keep the Shift key pressed while adding a point to keep the tool active and allow the selection of multiple points in a series of clicks.
- Remove a survey ROI.
Click the ROI marker with the mouse while you press the Delete key on the keyboard. If you remove all survey ROIs from the current SI mode, the STEM-SI palette automatically reverts to the mode selection state.
Survey ROI types
2D Array
 A regular 2D SI consists of an array of equally spaced points in X and Y. It is represented as a single, rectangle ROI in the survey image.
Resizing the survey ROI keeps the total number of pixels and the total acquisition time constant. When you resize the ROI, the SI size in pixels and the sampling resolution change automatically.
The survey ROI snaps to positions of the appropriate size and aspect ratio. The smaller the total number of pixels in the SI, the rougher those snaps may appear.
Line Scan
 A one-dimensional (1D) SI consists of an array of equally spaced points along a line. It is represented as a single, line ROI in the survey image. A yellow cross indicates the start position of the scan. If the averaging option is enabled, the cross is replaced by a yellow line that indicates the averaging direction and width.
Resizing the green survey ROI adjusts the sampling resolution but keeps the number of sampled points constant. Changing the dimensions of the yellow survey ROI adjusts the averaging width but keeps the number of sampling points along that direction constant. You can adjust the averaging direction angle by pressing the Ctrl key down while you drag the green handle of the yellow survey ROI. Deleting the yellow survey ROI will switch the averaging option off.
Multipoint
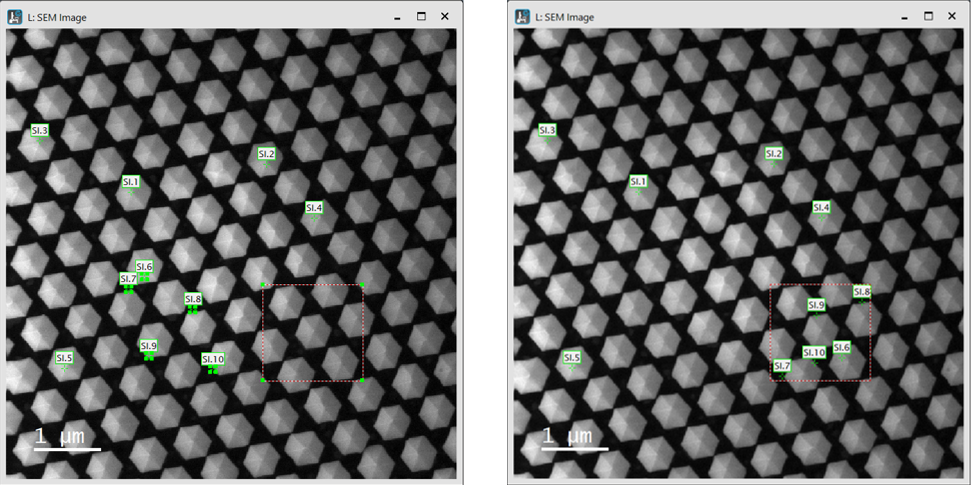
A set of point spectra acquired with identical parameters from individual spatial positions collected in a 1D SI data container. Each point is represented by a single ROI, a single, numbered point in the survey image. This number specifies the spectrum position within the SI data container.
Adding points from the floating menu using the SI ROI tool is most convenient. Holding the Shift key allows you to add multiple points in a series of mouse clicks. You can remove individual points by selecting them and pressing the Delete key. Once deleted, the remaining points are automatically renumbered.
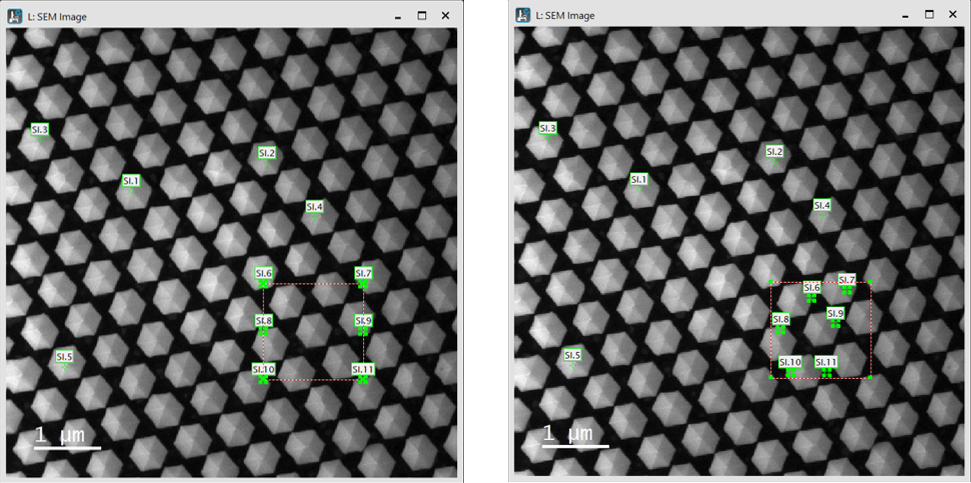
Click the Arrange points buttons to arrange the selected set of points or, if none are selected, all points. If a rectangular ROI is selected, the points are arranged within this area. Otherwise, they are arranged over the entire survey image.


Time Series
A set of spectra sequentially acquired with identical parameters from the identical sample area collected in a 1D SI data container. The sample position is represented by a point ROI for stationary acquisition or a rectangular ROI if the 2D Scan option is enabled.
Resizing the 2D Scan area is restricted by the number of sampling points of the scan, which is limited by the SI Pixel Time. Slower scans allow higher sampling. To access a larger scan area, it can be necessary to either reduce sampling with the spin controls for the 2D Scan fields and/or increase the Pixel Time.