Spectroscopy
Cathodoluminescence (CL) spectroscopy is useful for determining the emitted light's wavelength distribution. When the collected light is focused onto the entrance slit of an optical spectrograph or spectrometer, the light is dispersed (separated) by wavelength. Data may be in the form of individual spectra from a few well-chosen points (typically the highest quality spectrum) or spectrum imaging via the collection of a complete spectrum at each point (pixel) of an image. Spectrum imaging requires no a priori knowledge of a specimen and allows the use of advanced analysis techniques.
The spectroscopy workflow is relatively simple, as seen here:
-
Locate the region of interest within the sample.
-
Set the desired scanning electron microscope (SEM) conditions.
-
Ensure the alignment of the CL system to the SEM and sample is correct.
-
Define the position of the electron beam.
-
Optimize spectrum (optional).
The following pages focus on capturing a spectrum and optimizing the system to maximize spectral information and signal-to-noise ratio. Please follow the links for more information on steps 2 and 3.
Alignment for Spectroscopy
The alignment of the electron beam, cathodoluminescence system, and the sample are critical to capturing spectra with the highest signal-to-noise ratio and spectral resolution. Please refer to the alignment discussion to discover why this step is critical and the steps to take to capture the highest-quality spectra
Collecting Spectra
Acquire a spectrum
 There are two methods to collect a cathodoluminescence (CL) spectrum: wavelength-resolved and wavelength-filtered spectroscopy. The appropriate method depends on the type of detector you use. Please refer to the modes of operation section for more information.
Within DigitaMicrograph® software, go to the Spectroscopy technique to capture CL spectra:
 Position the beam on the sample region of interest using the Scan palette.
- Spot – Sets the beam at a particular location on (or to avoid damage, off of) the specimen.
- Focus – Scans a sub-region of the field of view.
Ensure that the refresh rate of the scan is shorter than the exposure time of the spectrum.
- Capture a spectrum.
Wavelength-resolved
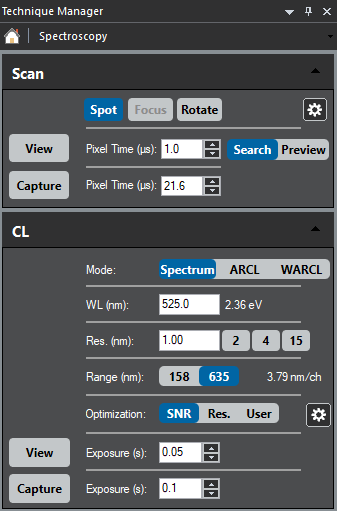
Use the CL palette to capture a wavelength-resolved spectrum. Simply press View or Capture to collect a CL spectrum.
- View – The spectrum continually updates per the exposure time selected
- Capture – Records a single CL spectrum, then opens the data and includes the SEM's electron beam location in a new workspace
The user interface allows you to control the capture of spectral information:
- WL (nm) – Designates the central wavelength of a CL spectrum
- Res. (nm) – Defines the instrument's spectral resolution (wavelength)
- Range (nm) – Select the appropriate button to choose the (wavelength) field of view in a CL spectrum; this selects a diffraction grating of different dispersion
- Optimization – Determines the read-out configuration of the detector
- SNR – High signal-to-noise
- Res. – High resolution
- User – User-defined binning and dark correction
The Spectrum Imaging section includes additional information regarding how to collect spatial and spectral information using the wavelength-resolved spectrum imaging mode.
 Wavelength-filtered
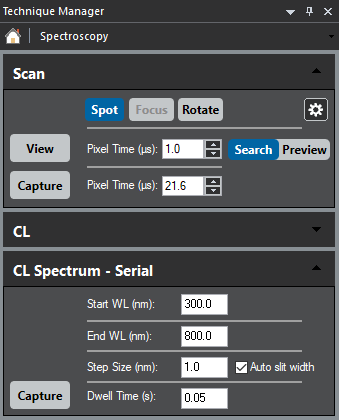
Use the CL Spectrum – Serial palette to capture a wavelength-filtered spectrum. Similar to above, simply press Capture to collect a CL spectrum.
- Start WL (nm) – Designates the short wavelength
- End WL (nm) – Defines the long wavelength
- Step Size (nm) – Select the wavelength interval to take each spectrum
When you select the Auto slit width checkbox, the system automatically sets the entrance and exit slit widths to maximize spectral resolution and throughput for the user-selected sampling step. - Dwell Time (s) – Time spent at each wavelength
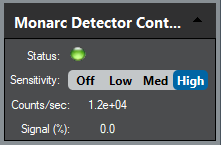
For systems that use a computer-controlled detector, you must select the correct detector and an appropriate sensitivity level from the Monarc/Vulcan Detector Control palette.
 The Wavelength-Filtered SI section includes additional information regarding how to collect spatial and spectral information using the wavelength-filtered spectrum imaging mode.
Optimizing Spectra
 When analyzing a specimen, the desired outcome is often to determine the natural emission spectrum of a specimen, e.g., the shape of a peak (or peaks) in a spectrum. However, several factors that determine the shape of a collected spectrum:
- The natural emission spectrum of the specimen
- Instrument contribution to the spectral resolution
- Change in sensitivity of the detection system across the measured range
Instrument contribution
The instrument spectral resolution is dependent upon the optical design of the spectrometer (fixed after purchase), the entrance slit width used, and the dispersion of the diffraction grating (or prism).
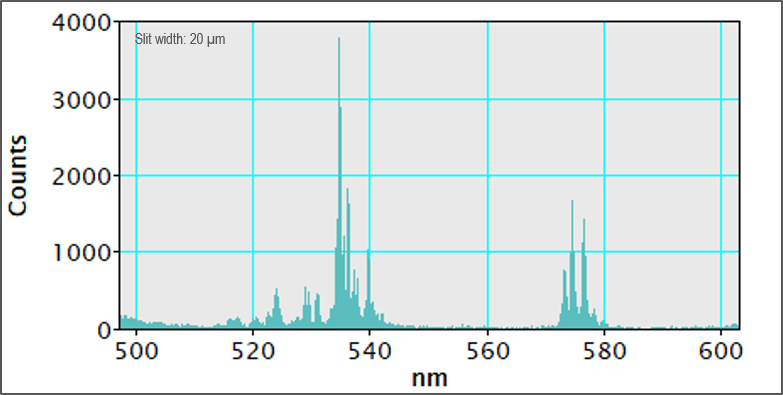
Influence of slit width
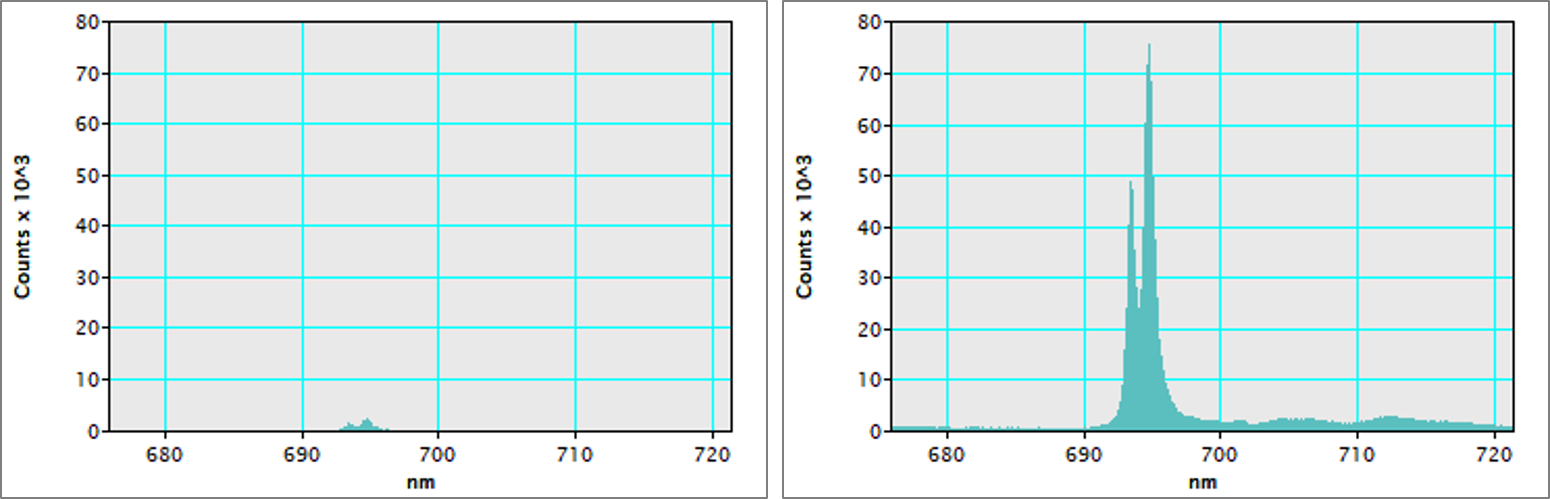
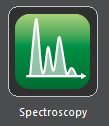
The entrance slit defines the range of incident angles that enter the spectrometer and contribute to the measured spectrum. By selection of a narrow slit, the accepted light has fewer aberrations and distortions. This leads to a more faithful representation of the natural emission spectrum, e.g., narrower slit widths deliver higher instrument spectral resolution and therefore contribute less spectral broadening to the measured spectrum. The use of a narrower slit width also results in a higher rejection of incoming light and a consequent reduction in the fluence (light throughput). The comparison of spectra from a phosphor sample below demonstrates that at large slit widths, fluence (light throughput) is high. Still, poor instrument spectral resolution obscures information in the emission spectrum. In this example, there is no benefit observed in the spectrum recorded with a 20 μm slit width compared to the 100 μm slit, but the fluence (counts) is lower, e.g., the spectrum recorded with a 20 μm slit has a poorer signal-to-noise ratio (SNR).
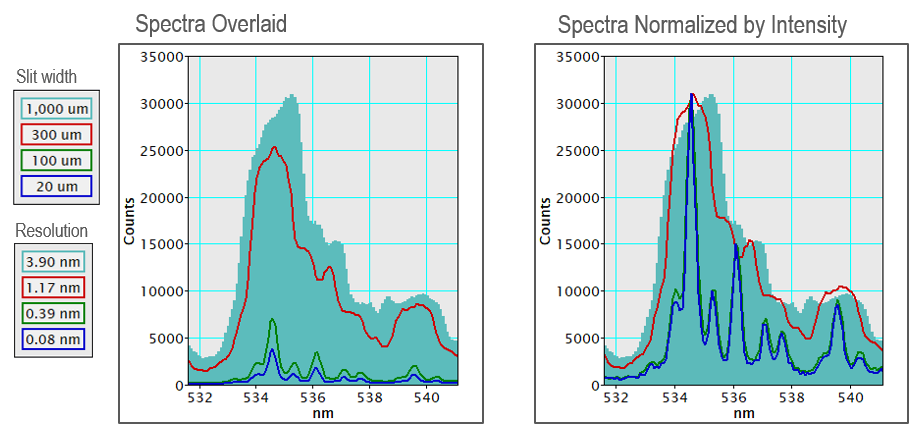
There is a trade-off between (instrument contribution to) spectral resolution and SNR in many situations. You may extend the measurement time to improve SNR based on the spectrum quality required for the desired analysis.
Diffraction grating selection
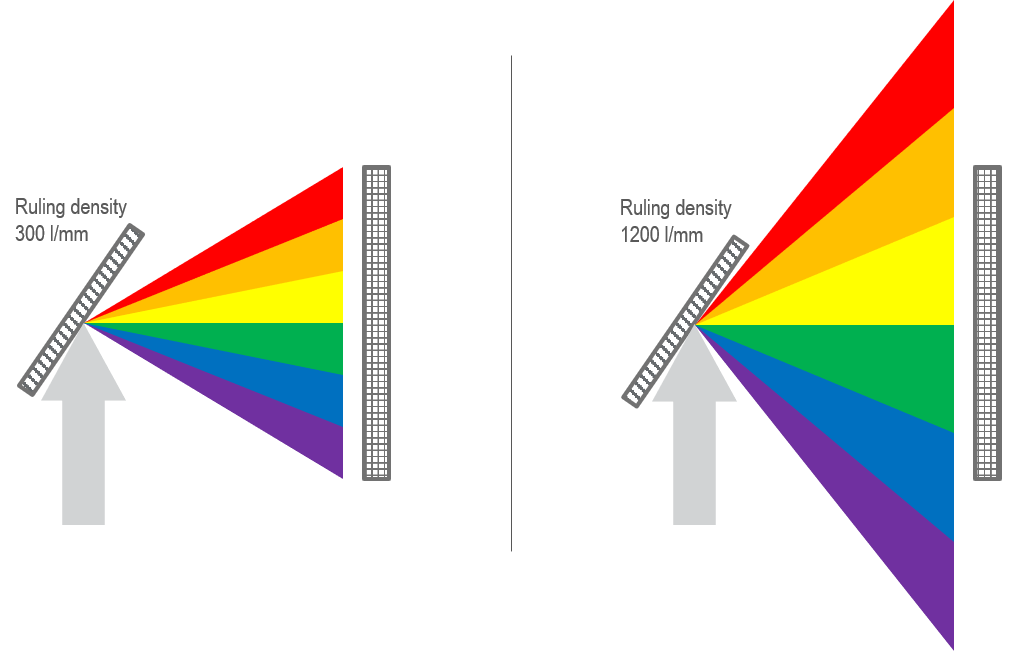
The diffraction grating (or prism) is the dispersive element within a spectrograph. The ability of a diffraction grating to separate light is based on the ruling density (lines or grooves per mm). The efficiency of a grating to reflect the light of a given wavelength (color) is determined by the ruling density and the blaze wavelength, the wavelength (color), with optimized reflection efficiency defined by the shape of grooves. The ruling density determines the reciprocal linear dispersion for a given spectrograph (nm/mm) or the spread of the wavelength (color) spectrum. The trade-off is between high spectral resolution and (wavelength) field of view. An aberration-corrected spectrograph provides a clear advantage since it simultaneously achieves the high spectral resolution, wide wavelength field of view, and high throughput.
Refer to the Tips and Tricks section to determine the optimal operational range of a diffraction grating.