Overview
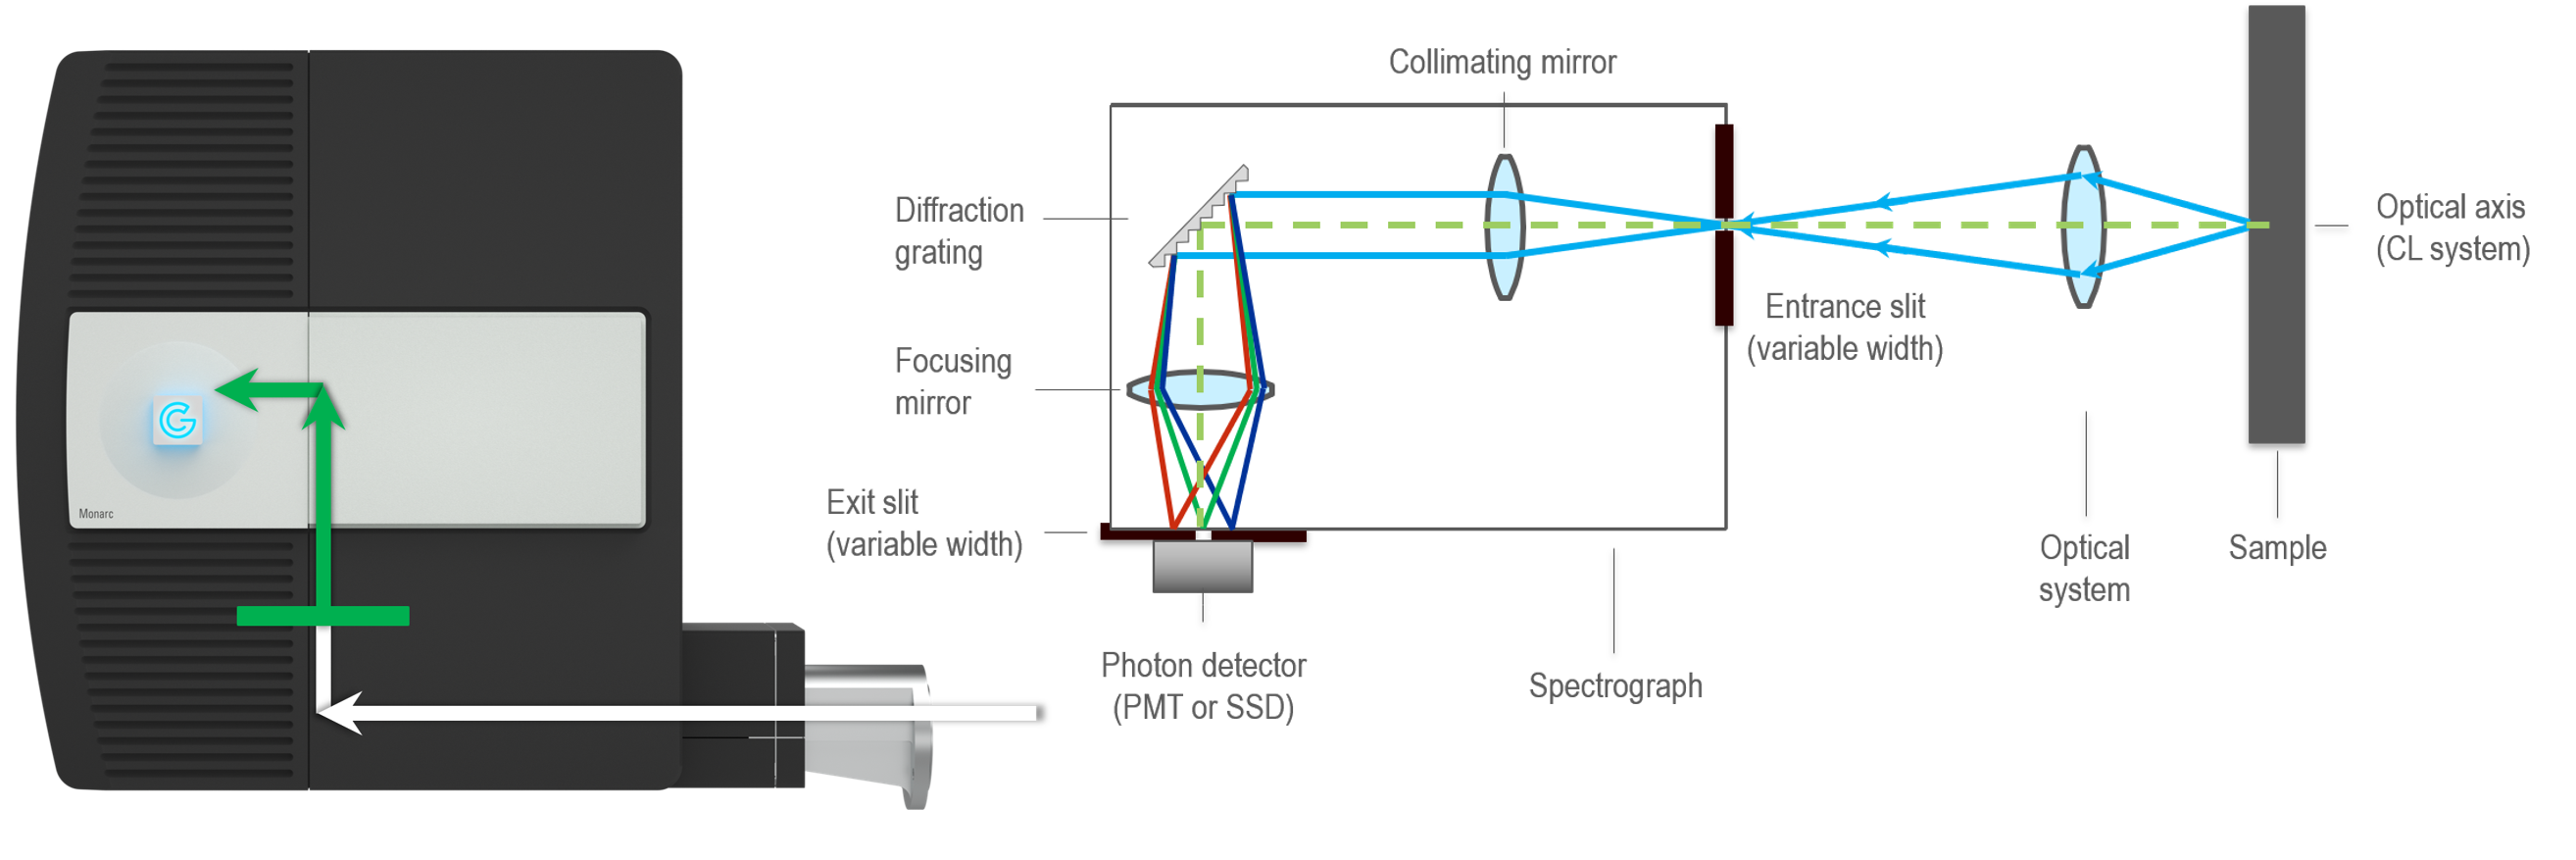
In wavelength-filtered mode, cathodoluminescence (CL) information is captured using only a (narrow) range of wavelengths. Typically, wavelength filtering is performed by detecting the light that passes through the wavelength-selecting (exit) slit of a scanning spectrometer or an optical transmission filter. An optical spectrometer provides the greatest flexibility in selecting the wavelength and wavelength range (band pass). Still, images generated in this way have a more inferior signal-to-noise ratio than an equivalent image captured using an optical filter due to higher losses through the spectrometer. However, having hundreds (or thousands) of optical filters with the desired transmission parameters is impractical, so scanning spectrometers are used widely.
Sometimes referred to as monochromatic imaging or spectral imaging.
Data collection
 Wavelength-filtered signal: The intensity of the emitted light recorded from a point or region of the sample exposed to the electron beam of the scanning electron microscope (SEM). The signal is limited to a small range of (user-defined) wavelengths; no angle or polarization information is contained.
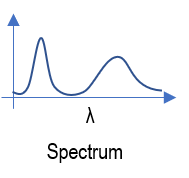 Wavelength-filtered spectrum: The wavelength distribution of the emitted light is captured. The wavelength-filtered signal is recorded over a user-defined range of wavelengths, one wavelength at a time. A scanning spectrometer is used to step through the wavelength range to build up a spectrum in a (wavelength) step-by-step approach. Sometimes referred to as serial spectroscopy.
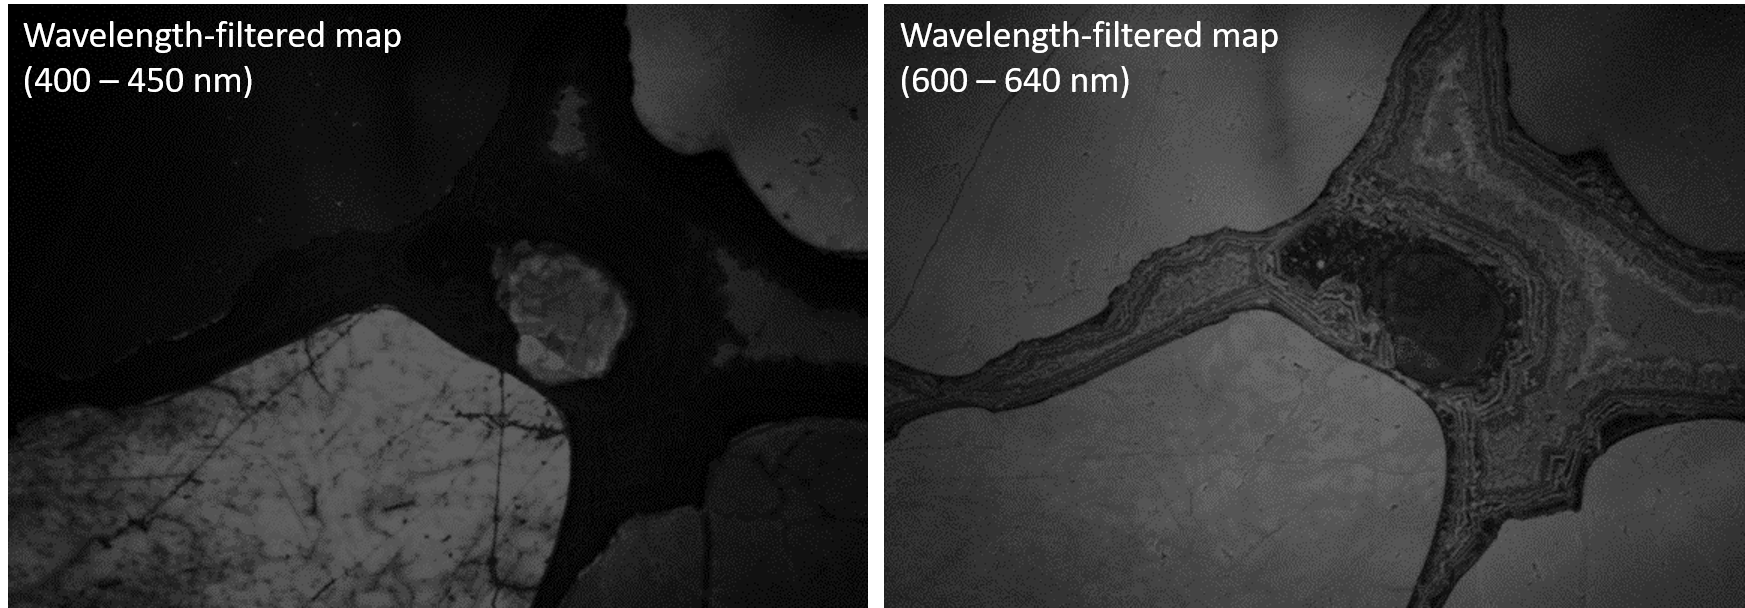
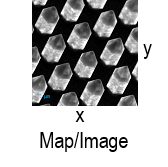
 Wavelength-filtered map: The electron beam is scanned across the specimen surface, and the wavelength-filtered signal is recorded at each location and displayed as a (2D) map. More than one wavelength-filtered map may be recorded from the same specimen region. Typically, a user defines two (or more) wavelength ranges, enabling the spatial distribution of emission centers to be discriminated against.
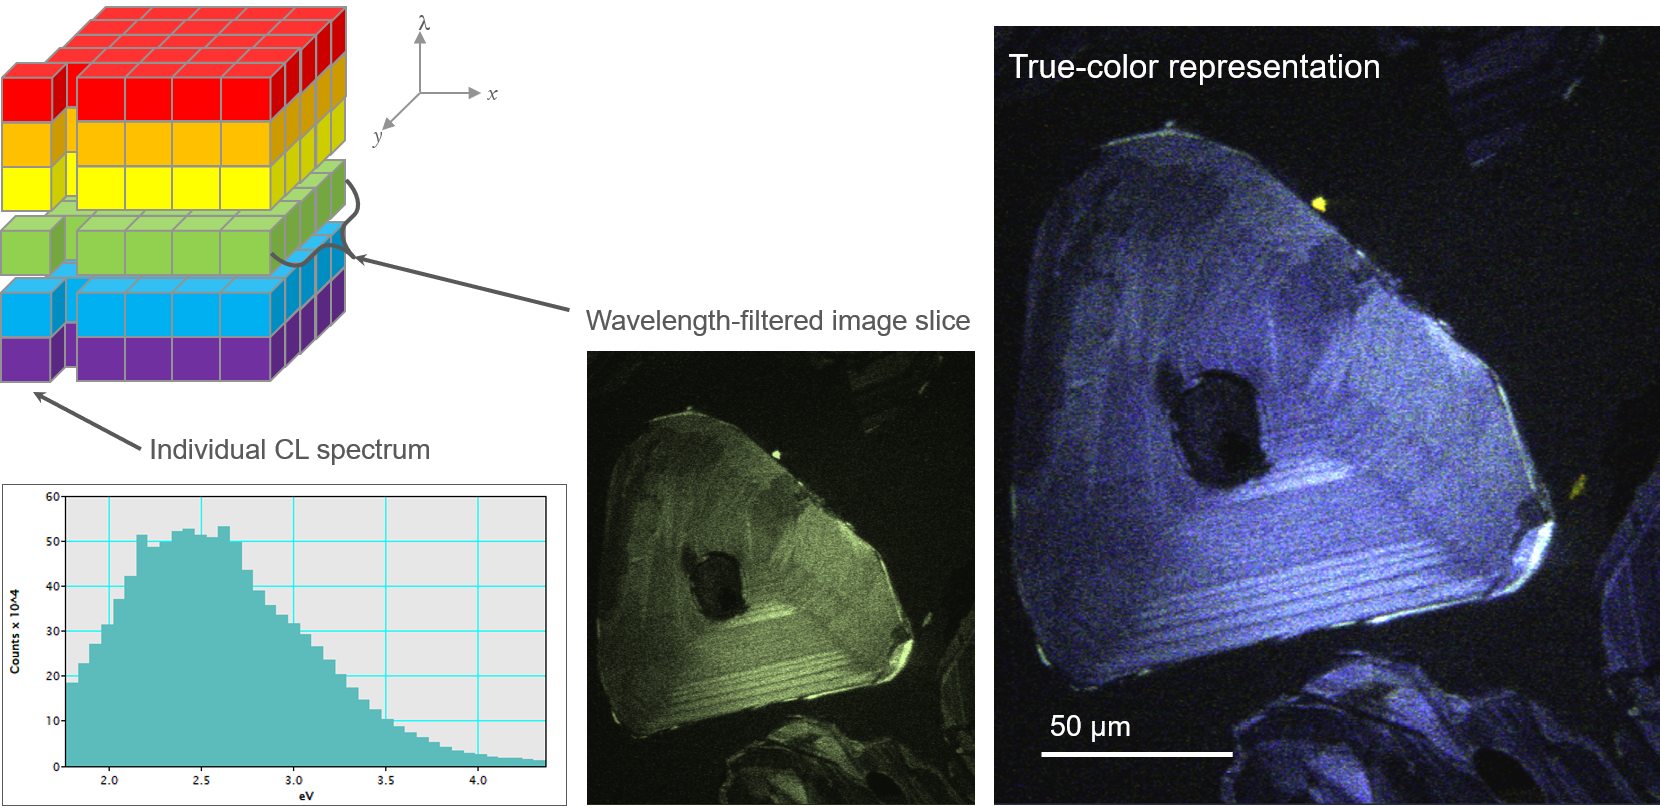
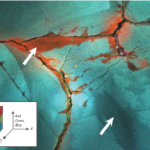
 Color map: A unique form of wavelength-filtered mapping captures three discrete wavelength bands corresponding to the visible spectrum's red, green, and blue components. The three components are recombined to form a color image in much the same way as the viewing screen of a color television. Some specialized detectors, such as the ChromaCL2™ detector, capture the color components simultaneously, enabling color images to be captured in a single electron beam pass. More typically, sequential scans of the electron beam are required, with the user changing the color component detected between scans of the electron beam.
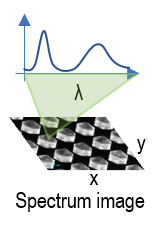 Wavelength-filtered spectrum image: A spatially and spectrally resolved (3D) hyperspectral data cube is captured by collecting a series of (aligned) wavelength-filtered maps.
In this acquisition mode, a PMT detector collects n wavelength-filtered CL images whose pixel time in each image slice can be collected thousands of times faster than an array detector used in the wavelength-resolved approach. Spectrum images with 167 wavelength channels may be collected up to 30x quicker.
Uses
Discriminate materials by composition and/or crystal structure, reveal the purity of semiconductor materials and determine resonance modes in nanophotonic materials.
 |
 |
| Determining photonic band structure by energy-momentum spectroscopy in an electron microscope | Cathodoluminescence techniques for the geosciences |