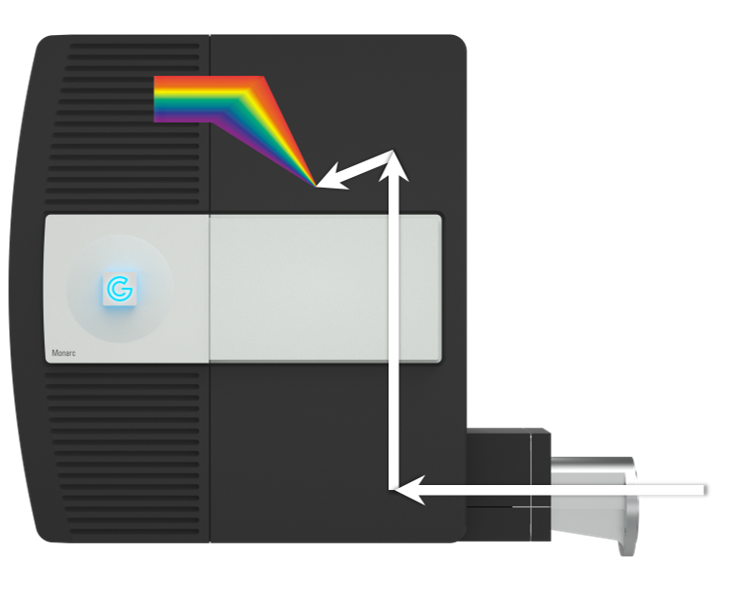
Overview
 Wavelength- and angle-resolved cathodoluminescence (WARCL) mode enables spectroscopic analysis of a sample's emission pattern. The data is collected as a 3D data cube (λ, θ, Φ) and can be considered a stack of wavelength-filtered emission patterns or a (wavelength) spectrum recorded in every emission direction.
It was sometimes referred to as energy-momentum spectroscopy.
Data collection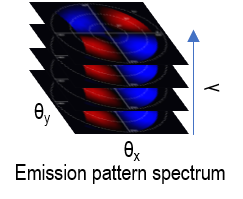
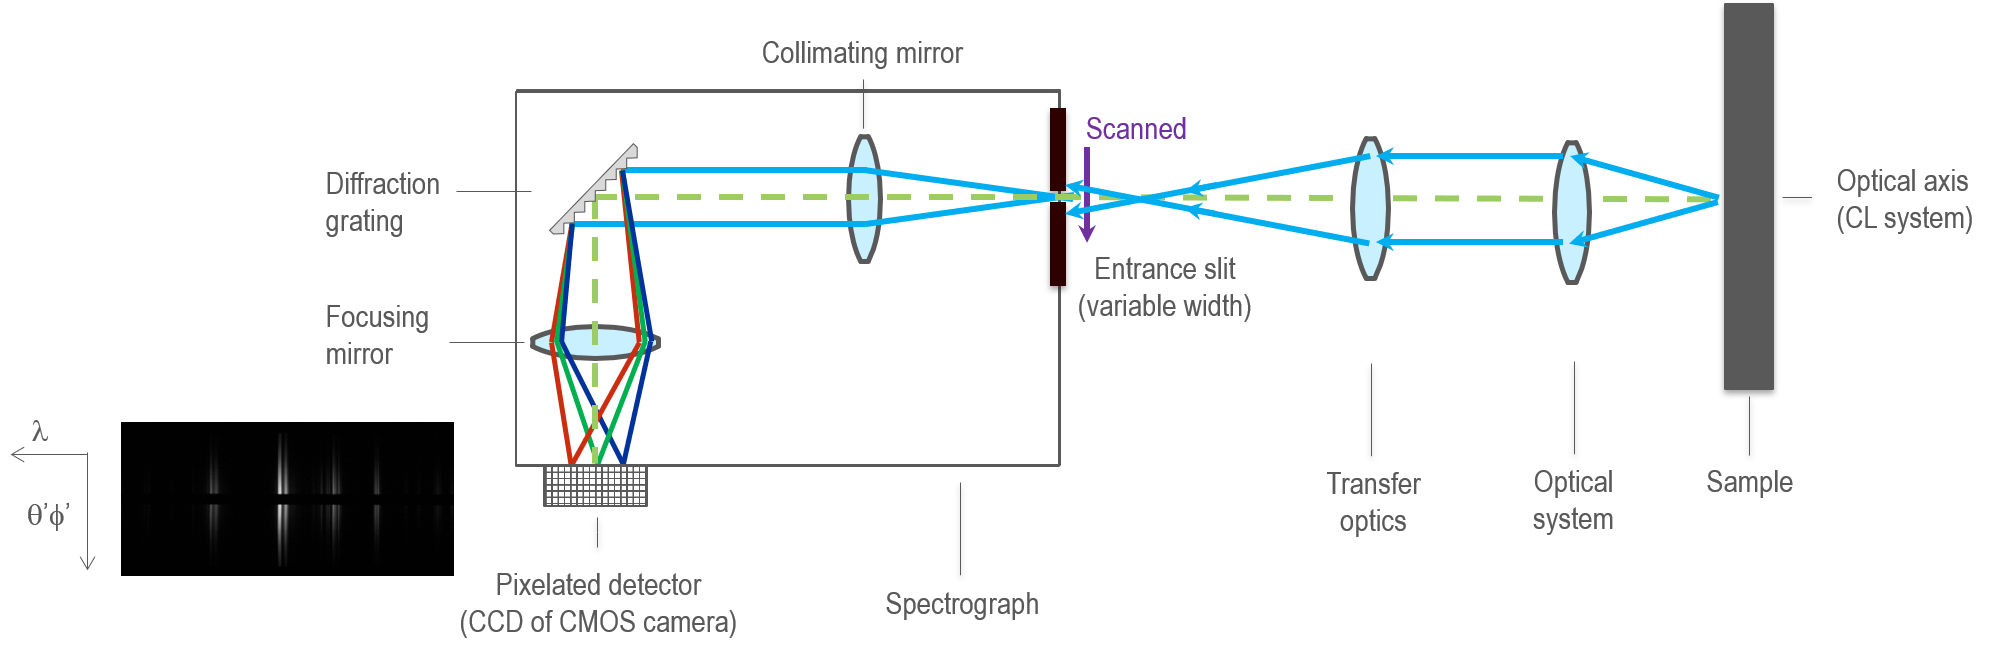
Data collection utilizes an angle-selecting slit to select a portion of the angle space before using an imaging spectrograph to disperse by wavelength. Commonly, for higher spatial and spectral resolutions, the angular range is scanned sequentially to reconstruct the data cube (λ, θ, Φ).
Uses
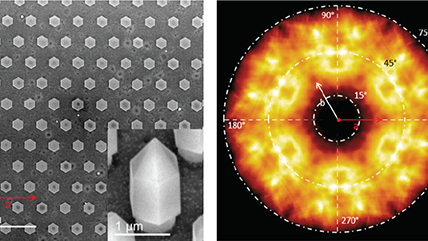
To understand how light and matter interact down to the nanoscale, it is important to understand the wavelength distribution (color) of light-emitting devices as a function of viewing angle and determine energy-momentum diagrams of photonic samples.
An emission pattern spectrum from a micro-LED array reveals distinct emission patterns to be observed at each wavelength; the data has been colorized according to the wavelength. The static images show the emission pattern at each corresponding color, and the video represents the entire dataset, which consists of emission patterns recorded at 1340 wavelengths across the visible spectrum.
 |
Determining photonic band structure by energy-momentum spectroscopy in an electron microscope |