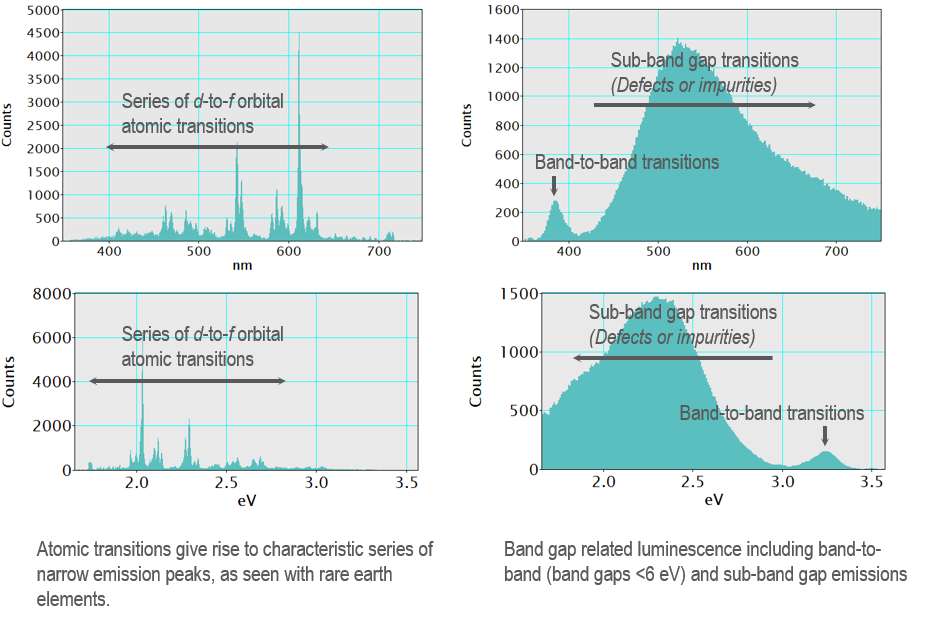
A key method for investigating samples is wavelength spectroscopy. Light is dispersed by wavelength (energy or color) using an optical spectrometer or spectrograph, and the resulting dataset is a one-dimensional plot of intensity versus wavelength. Luminescence spectra are typically a series of lines or peaks of finite width on a zero-level background. The peak shape, central wavelength, and full-width half maximum (FWHM) are essential characteristics that assist in identifying the mechanism responsible for the luminescence. However, unambiguously assigning the species responsible is often difficult without other information.
In atomic emission spectroscopy, the emission spectrum consists of a series of narrow lines that are a fingerprint of an element; the luminescence lines correspond to an atom's discrete inter-orbital energy transitions. In a solid, the crystal structure results in energy bands rather than discrete energy levels, and consequently, the emission lines broaden into peaks. The wavelength of the peak is characteristic of the energy transitions, but a direct physical interpretation of the FWHM is more difficult to provide general guidance for. In cathodoluminescence spectra, you can measure interatomic transitions in some samples (such as the d-to-f orbital transitions of a rare earth element), and these result in a series of peaks with narrow FWHM largely independent of the host crystal. In contrast, band-to-band transitions in semiconductors and luminescence from transition metal impurities in insulators often give rise to broad emission peaks. Understanding the sample (composition) and its electronic structure is required to interpret a luminescence spectrum.

When you use cathodoluminescence to infer composition or crystal quality, it is often necessary to refer to the published literature or other experimental methods where a systematic analysis was performed to make unambiguous conclusions. A large body of published spectra is available in the literature, although there have been few attempts to collate this information into a reliable library. One useful example—especially for geoscience applications—is here: https://luminescence.csiro.au/luminescence. Although, note that no comment is made on the accuracy or fidelity of the data contained therein.
The most common analysis method uses mathematical functions to provide an interactive means to fit functions to spectral data, including non-linear-least-square (NLLS) fitting using Gaussian or Lorentzian functions. This method allows for the accurate deconvolution of overlapping spectral features and, in hyperspectral data (spectrum images), is useful to map the spatial variation in intensity, wavelength, and FWHM of a spectral feature. This is particularly valuable as it allows you to map a sample's composition, stress, strain, and many other properties with extreme sensitivity. Please refer to the Least-Square Fitting section that describes the linear least-squared fitting routines within DigitalMicrograph® software.