Overview
In unfiltered mode, the intensity (magnitude) of the cathodoluminescence (CL) signal is measured. The measurement is integrated over all wavelengths, angles, and polarizations for a defined time interval.
Sometimes referred to as panchromatic, polychromatic, or black-and-white imaging.
Data collection
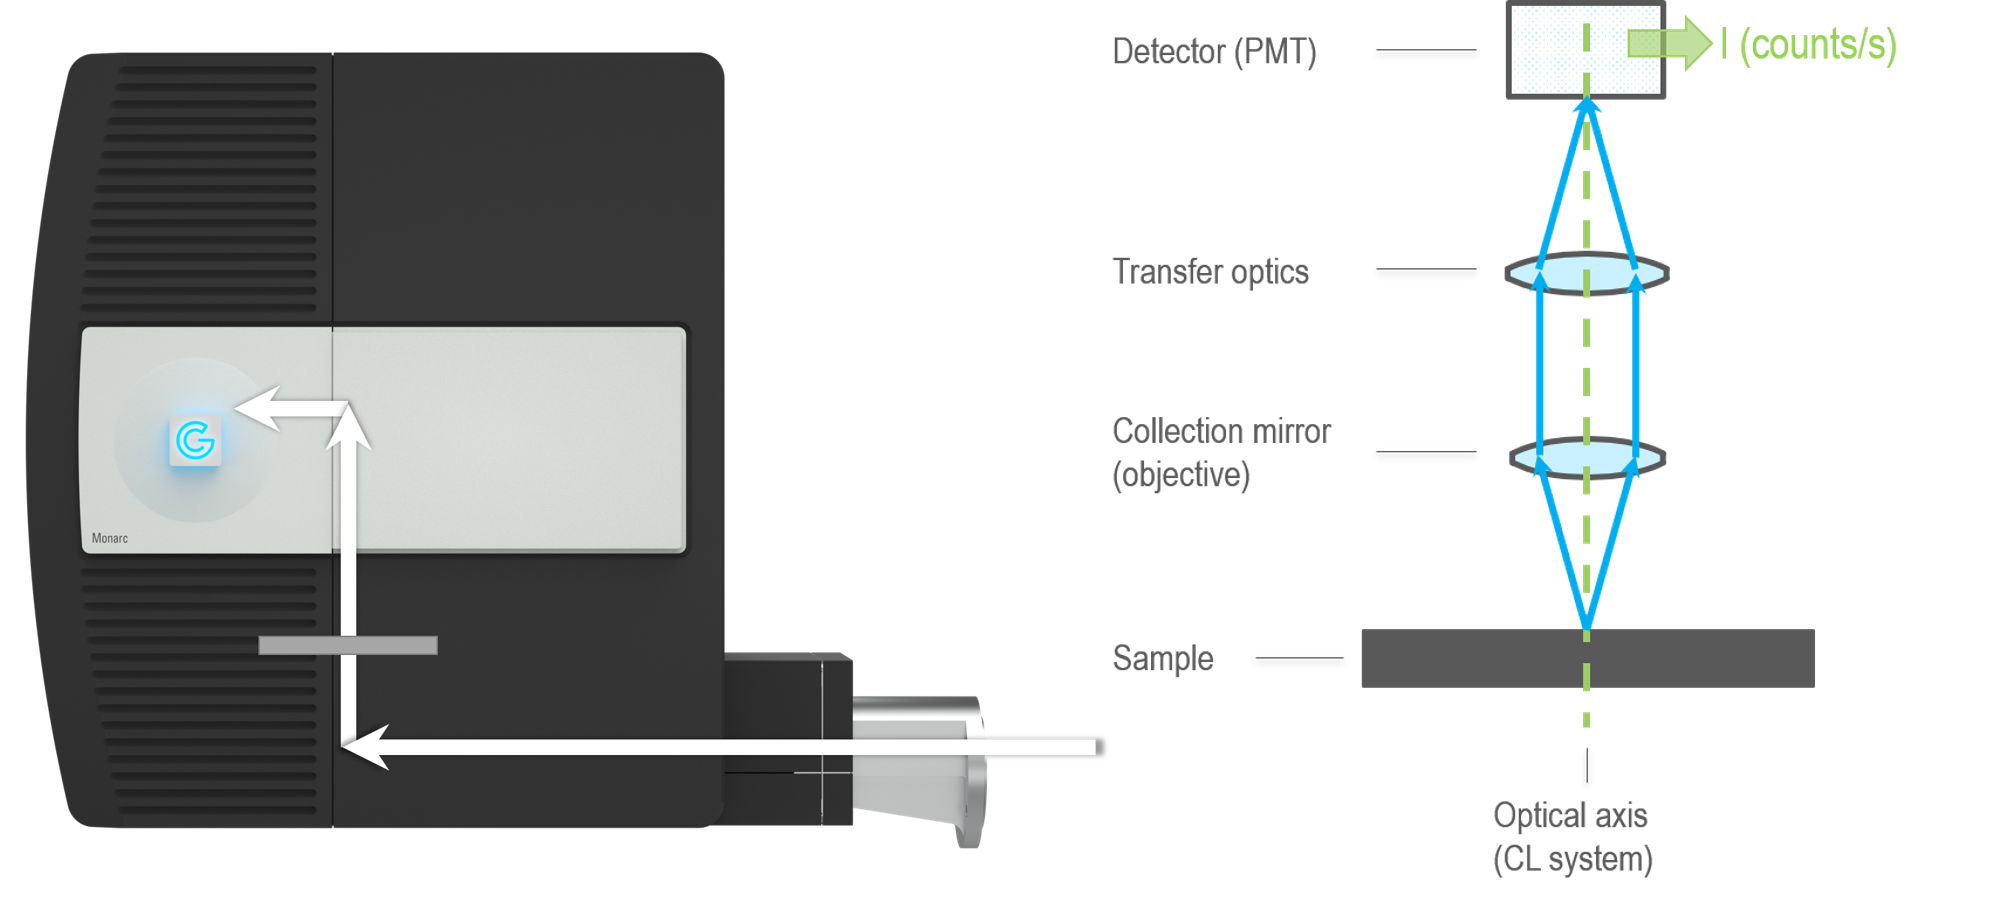
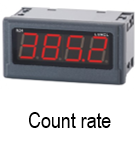 Unfiltered signal: The magnitude of the total CL signal (count rate or intensity) is measured using a light-sensitive detector such as a photomultiplier tube (PMT) or solid-state diode. The electron beam of the electron microscope may be continuously positioned at a defined location on the specimen (spot mode) or scanned rapidly over a defined area, and the measured CL signal is integrated over all locations.
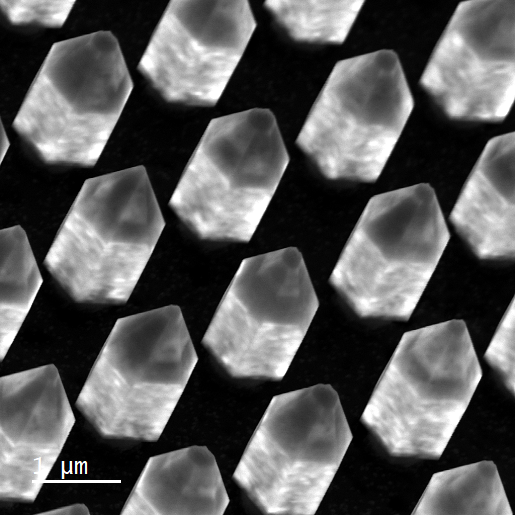
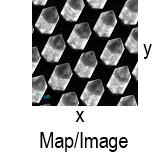 Unfiltered map: The electron beam is scanned across the specimen surface, and the emitted light intensity is recorded at each location and displayed as a map.
Uses
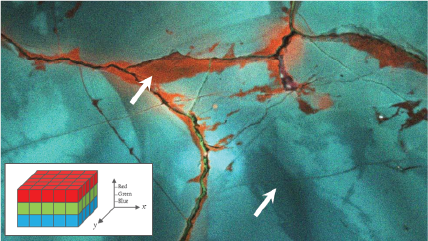
Reveal texture in mineralogy, zonation, overgrowths, and micro-cracks; and reveal extended defects in semiconductor materials and devices.
 |
Cathodoluminescence techniques for the geosciences |