 Revealing the distribution of materials at the spatial resolution provided by a scanning electron microscope is important in many applications, including composite materials—where physical properties critically depend on component distribution and morphology—and foreign body analysis. In the case of organic materials, standard imaging and analysis techniques are often unable to identify and distinguish materials unambiguously. An alternative technique that can differentiate materials independent of their elemental composition is necessary in such cases.
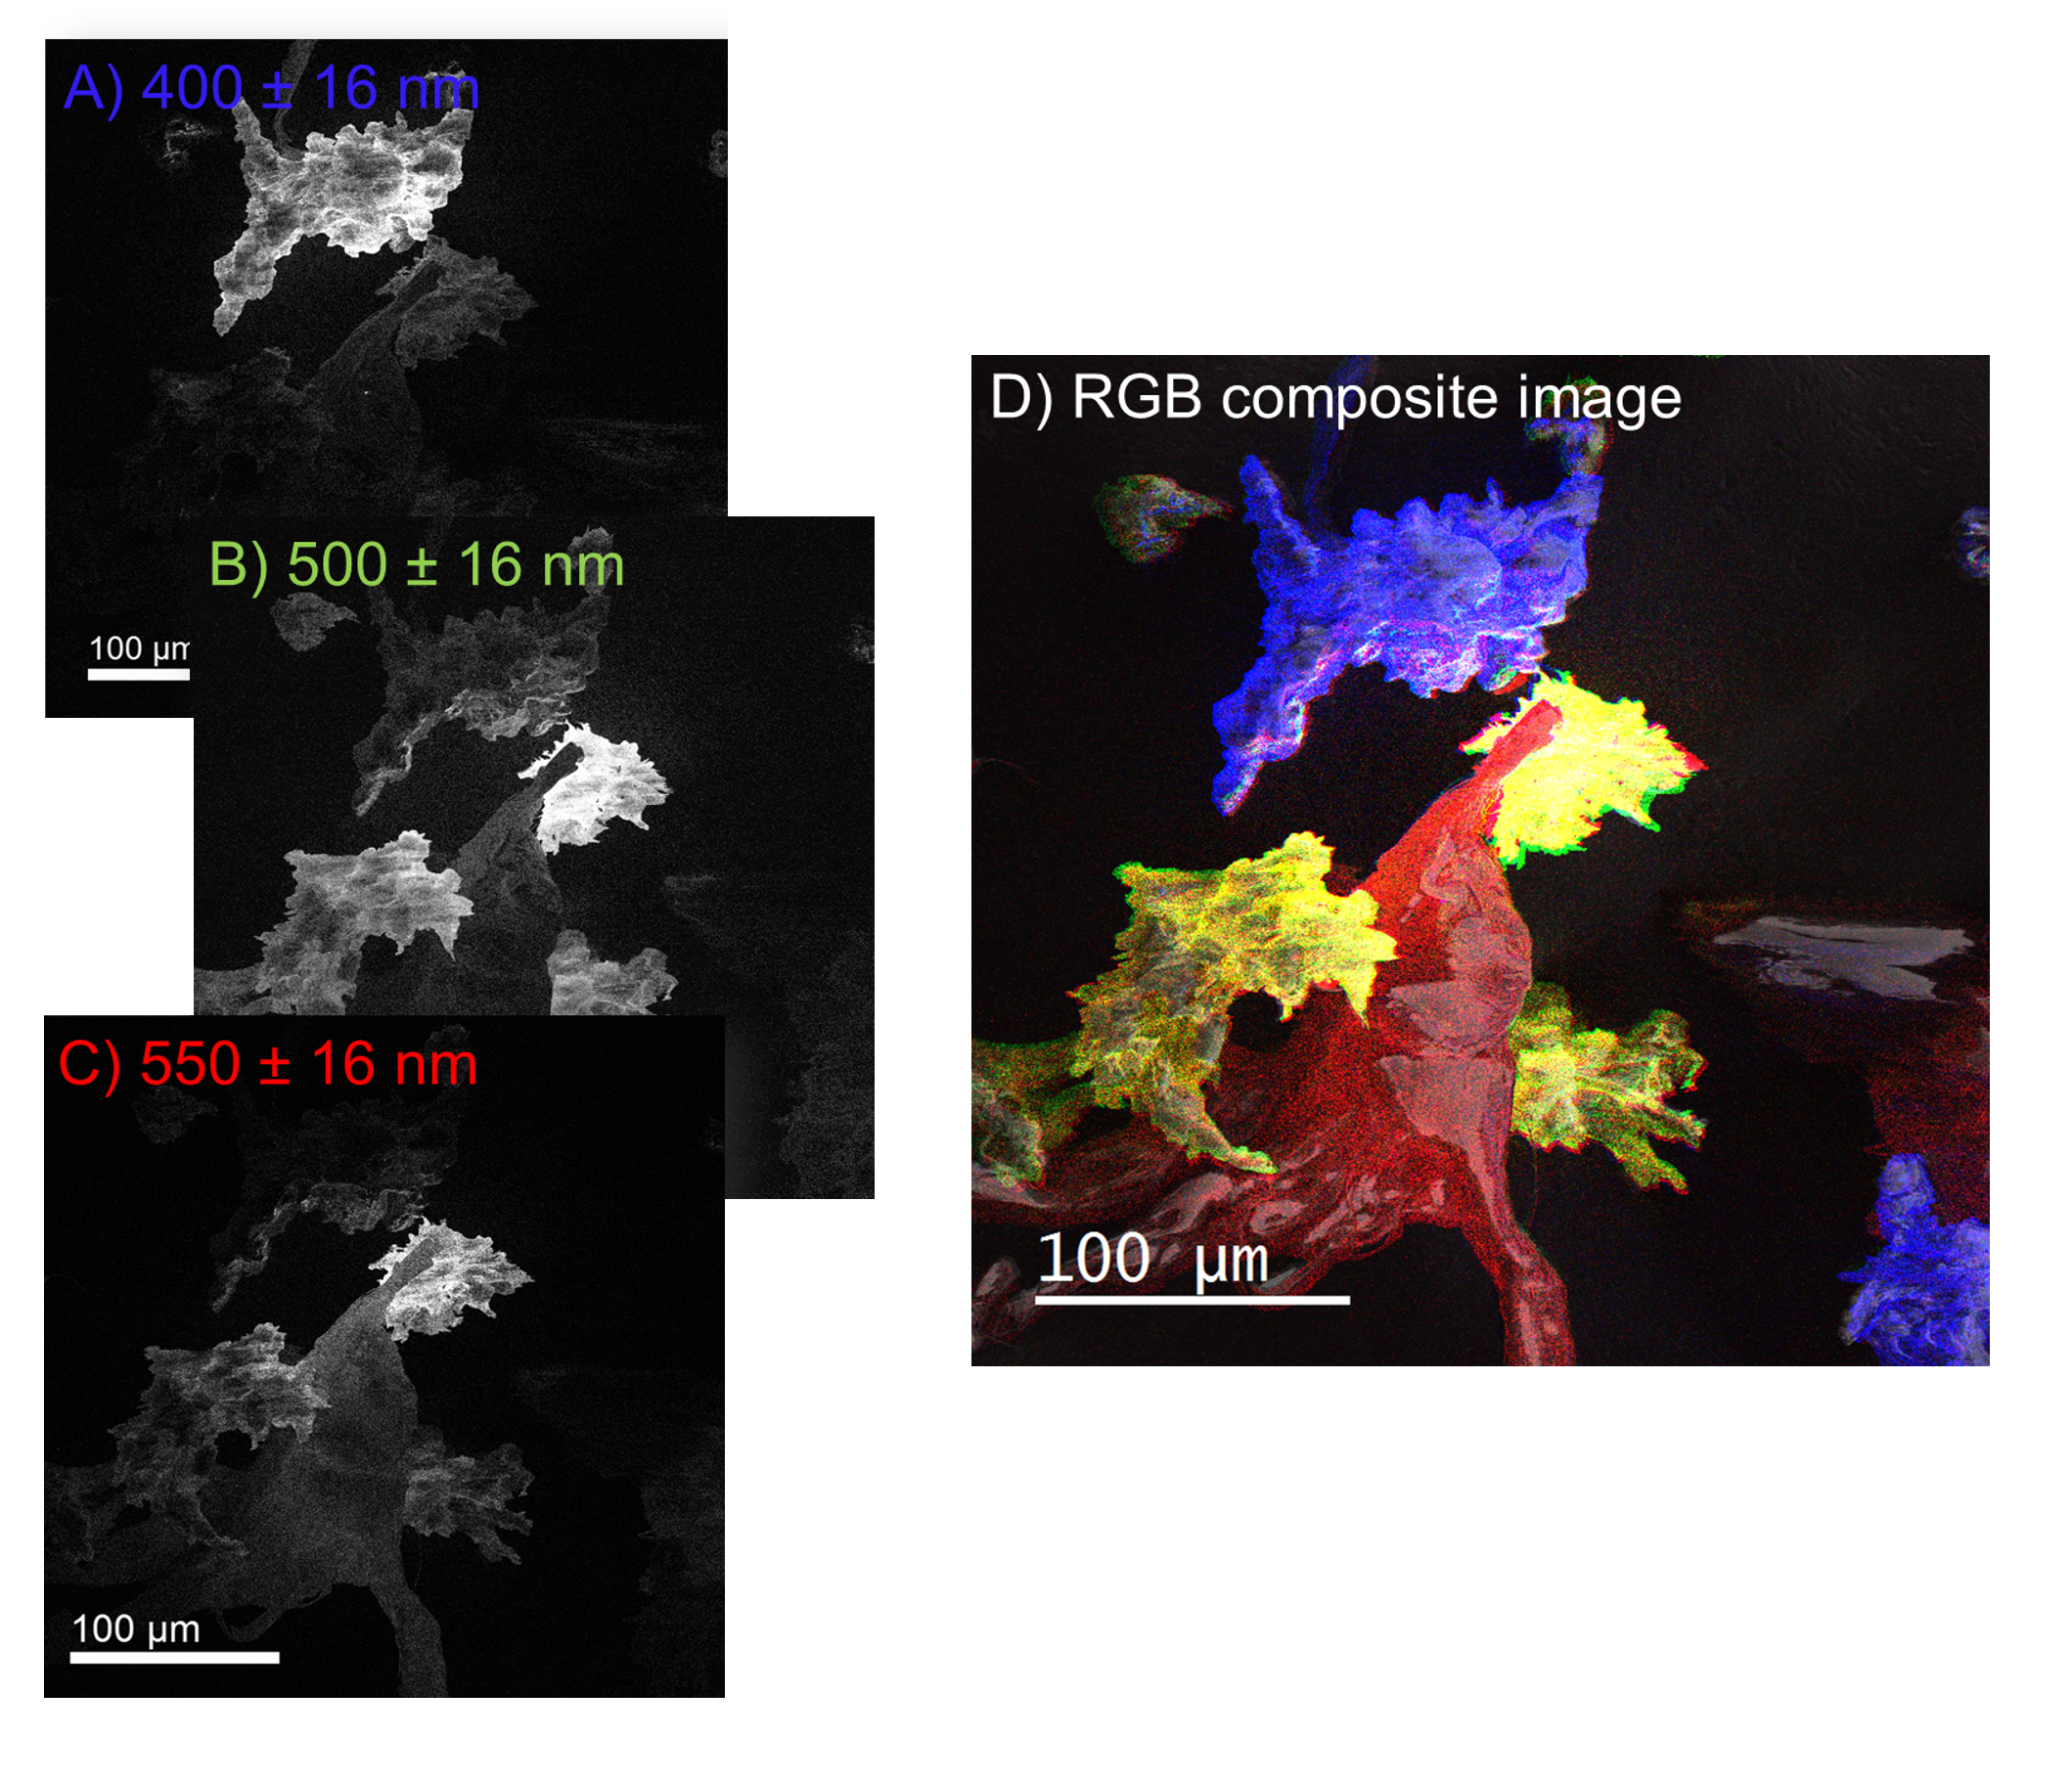
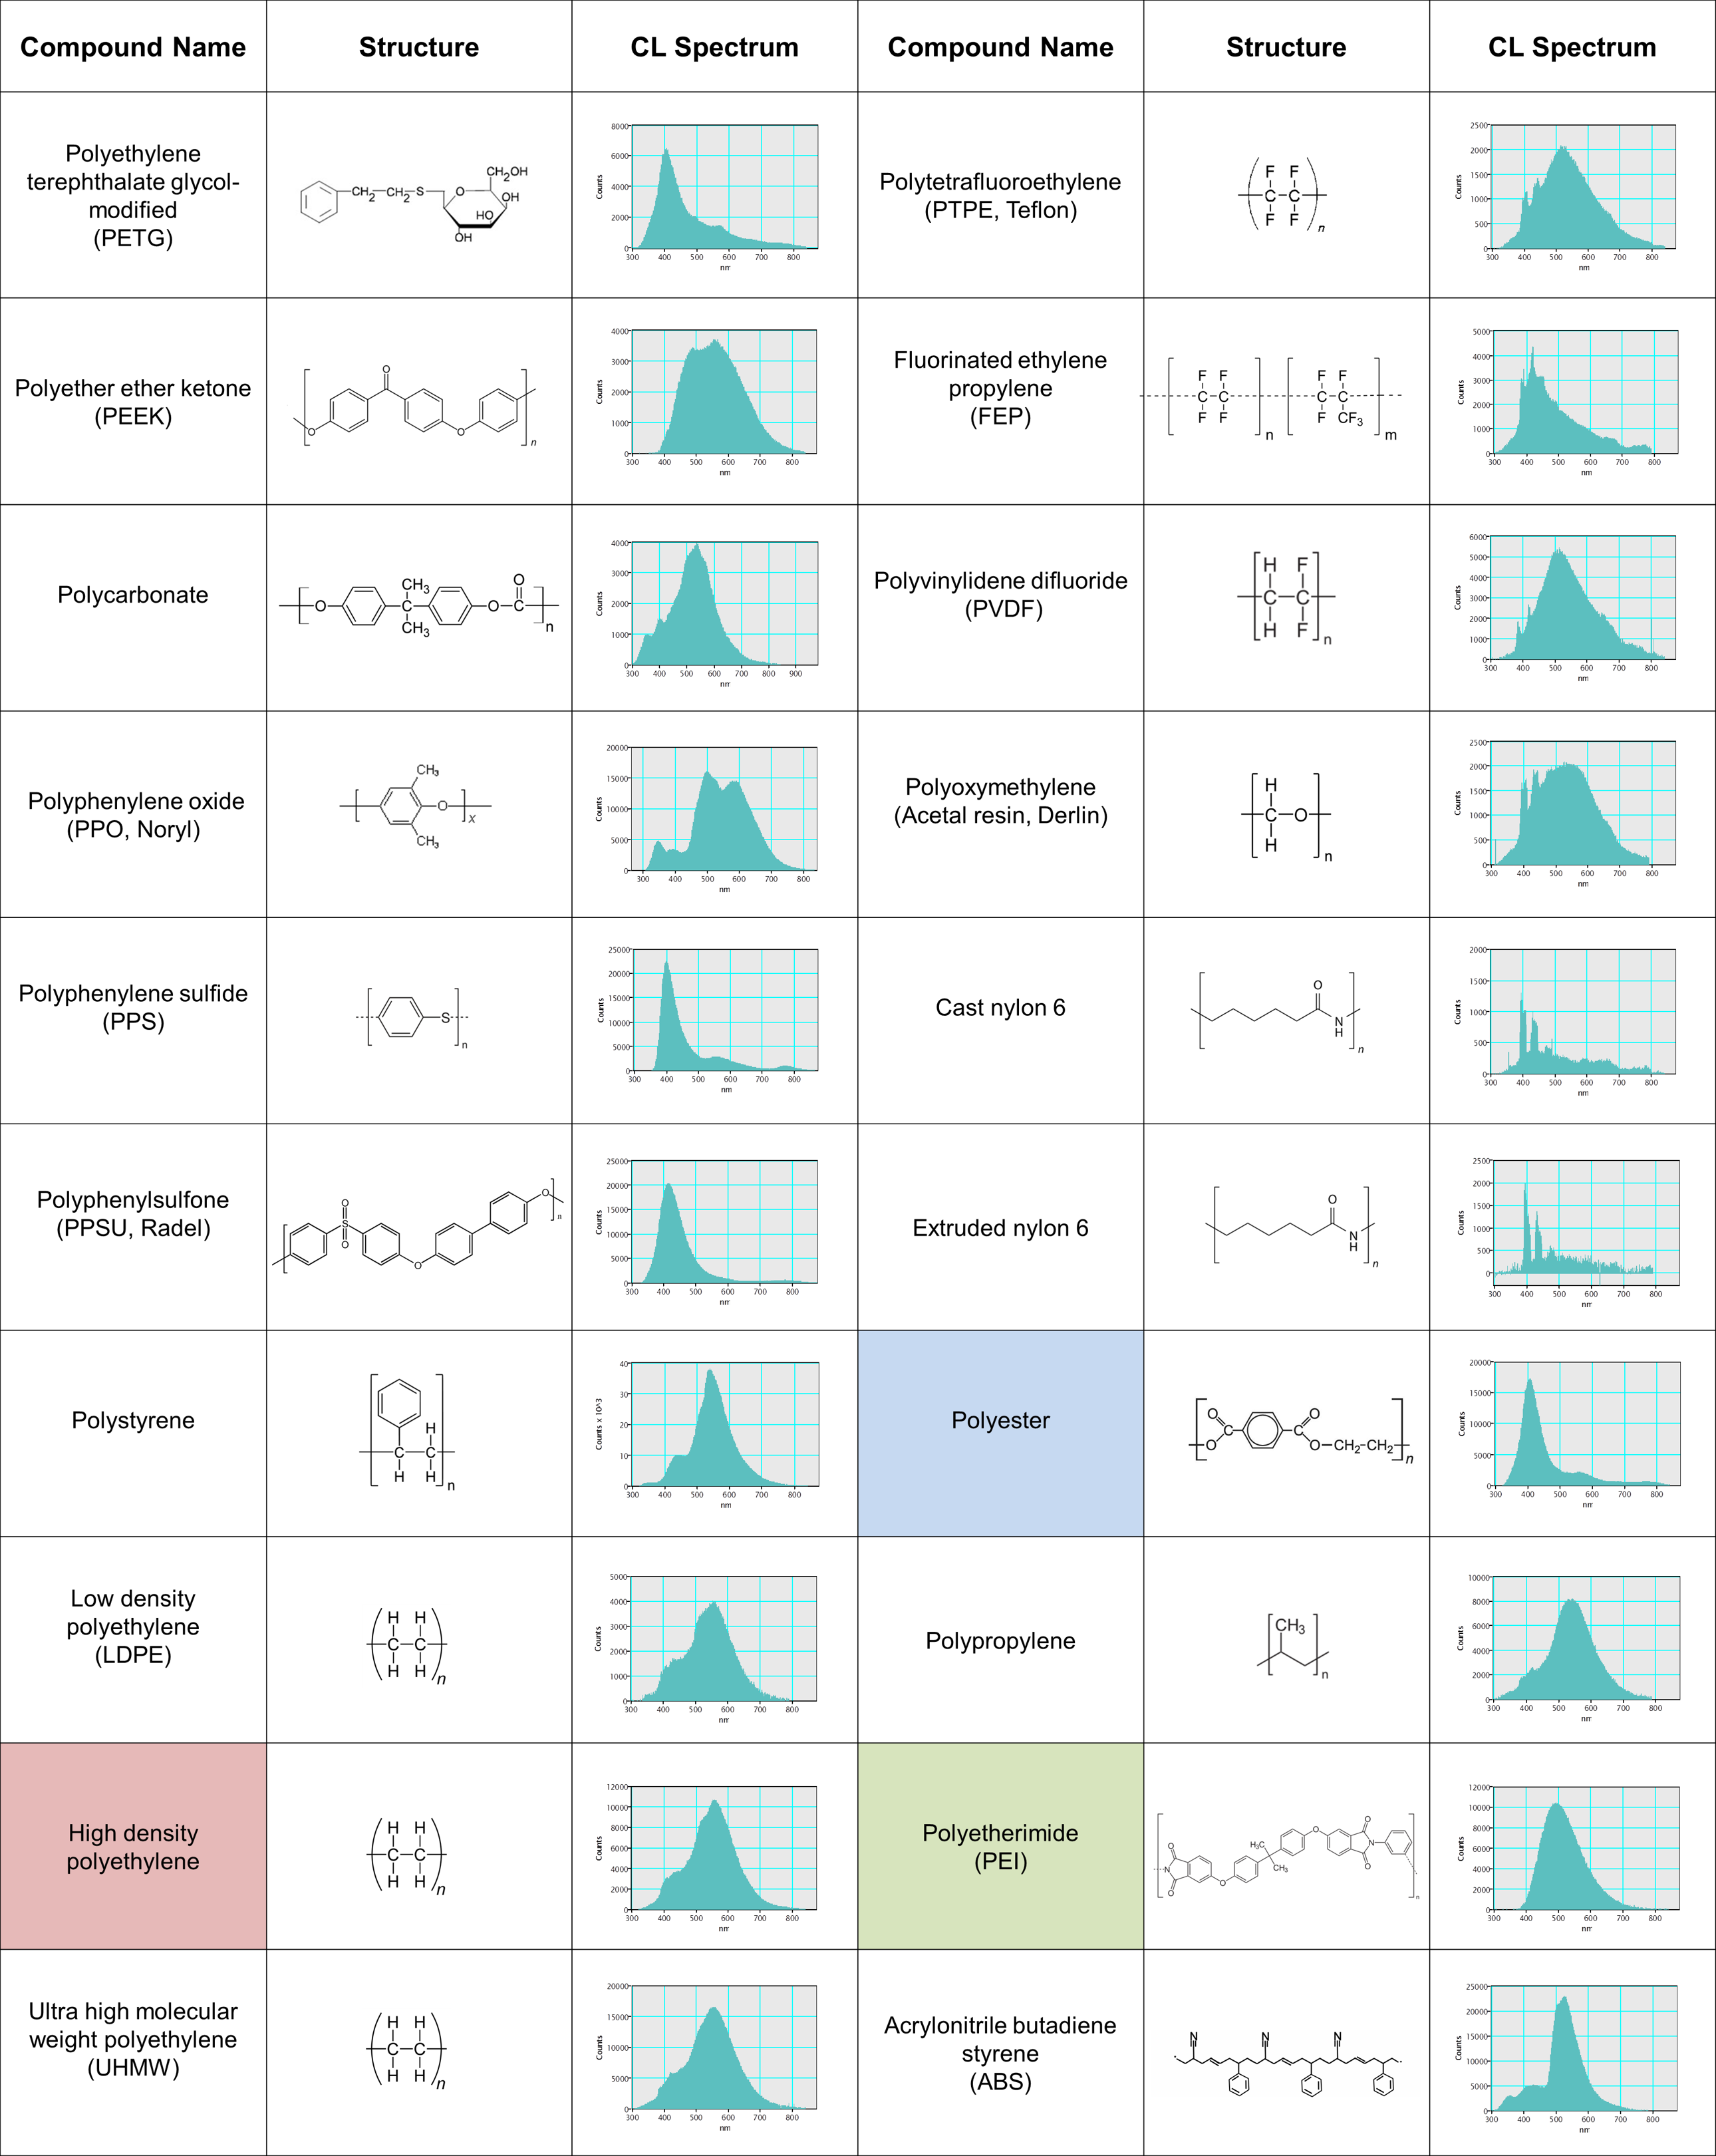
Cathodoluminescence (CL) analysis of organic molecules depends on the molecular structure and inter-molecule interactions rather than elemental composition. Many polymers are cathodoluminescent and are distinguishable based on their wavelength spectrum (see table). As an example, wavelength-filtered CL maps are shown to reveal the distributions of three-component ingredients from a compound specimen: polyester ((C10H8O4)n), high-density polyethylene ((C2H4)nH2), and polyetherimide ((C37H24O8N2)n).