 When analyzing a specimen, the desired outcome is often to determine the natural emission spectrum of a specimen, e.g., the shape of a peak (or peaks) in a spectrum. However, several factors that determine the shape of a collected spectrum:
- The natural emission spectrum of the specimen
- Instrument contribution to the spectral resolution
- Change in sensitivity of the detection system across the measured range
Instrument contribution
The instrument spectral resolution is dependent upon the optical design of the spectrometer (fixed after purchase), the entrance slit width used, and the dispersion of the diffraction grating (or prism).
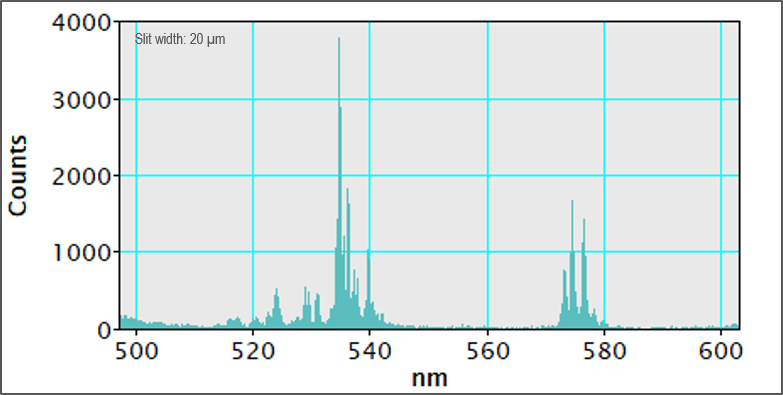
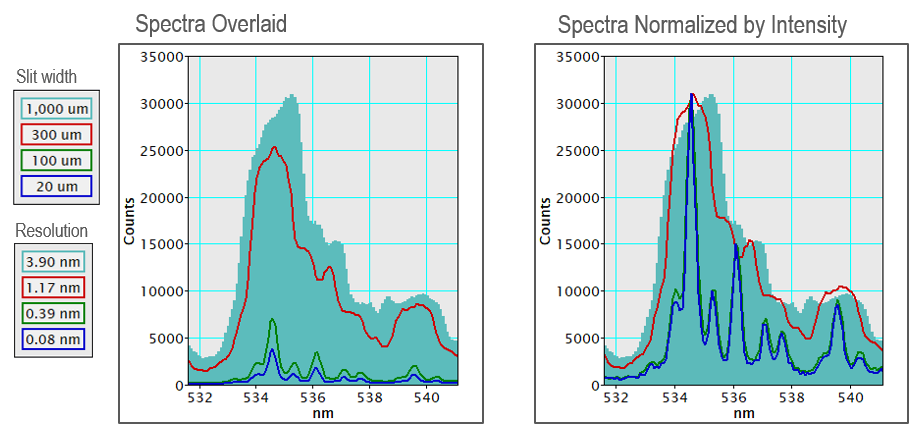
Influence of slit width
The entrance slit defines the range of incident angles that enter the spectrometer and contribute to the measured spectrum. By selection of a narrow slit, the accepted light has fewer aberrations and distortions. This leads to a more faithful representation of the natural emission spectrum, e.g., narrower slit widths deliver higher instrument spectral resolution and therefore contribute less spectral broadening to the measured spectrum. The use of a narrower slit width also results in a higher rejection of incoming light and a consequent reduction in the fluence (light throughput). The comparison of spectra from a phosphor sample below demonstrates that at large slit widths, fluence (light throughput) is high. Still, poor instrument spectral resolution obscures information in the emission spectrum. In this example, there is no benefit observed in the spectrum recorded with a 20 μm slit width compared to the 100 μm slit, but the fluence (counts) is lower, e.g., the spectrum recorded with a 20 μm slit has a poorer signal-to-noise ratio (SNR).
There is a trade-off between (instrument contribution to) spectral resolution and SNR in many situations. You may extend the measurement time to improve SNR based on the spectrum quality required for the desired analysis.
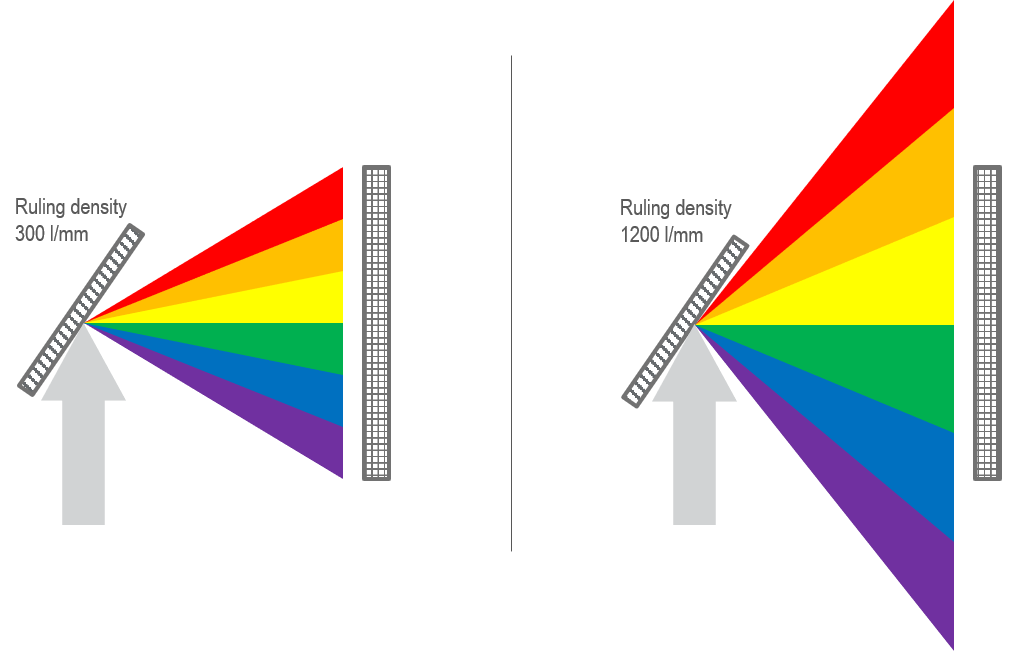
Diffraction grating selection
The diffraction grating (or prism) is the dispersive element within a spectrograph. The ability of a diffraction grating to separate light is based on the ruling density (lines or grooves per mm). The efficiency of a grating to reflect the light of a given wavelength (color) is determined by the ruling density and the blaze wavelength, the wavelength (color), with optimized reflection efficiency defined by the shape of grooves. The ruling density determines the reciprocal linear dispersion for a given spectrograph (nm/mm) or the spread of the wavelength (color) spectrum. The trade-off is between high spectral resolution and (wavelength) field of view. An aberration-corrected spectrograph provides a clear advantage since it simultaneously achieves the high spectral resolution, wide wavelength field of view, and high throughput.
Refer to the Tips and Tricks section to determine the optimal operational range of a diffraction grating.