 Least-Square Fit Setup
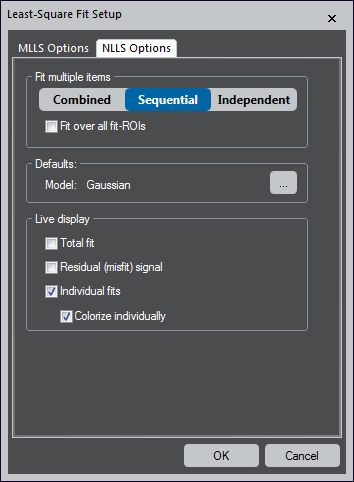
NLLS Options
Fit multiple items – Choose the fit behavior when multiple items are in the model list. This is useful for various applications since it profoundly impacts the results and different modes.
- Combined – Uses all items together as a single parameterized model that is optimized simultaneously over all specified fit-ranges
- Sequential – Fits each item on the list one after the other
The first item is fitted to the original data. Each additional item is fitted to the residual data of the previous fitting. The user may choose to optimize each fit over an individual or all specified fit-ranges.
- Independent – Each item is independently fit, and its parameters are optimized only over its fit-range
Defaults – Click the ... button to set the default model
Live display – Defines what options are shown as an overlay during live-fitting. These options are best explored by simultaneously observing a running live-fit.
- Total fit – Shows a slice that constitutes the sum of all references weighted by its fit coefficients
- Residual (misfit) signal – Displays a slice that represents the difference of the total fit (see above) and the actual data
- Individual fits – Presents a slice for each reference
- Colorize individually – Assigns a different color to each slice and is only available when you select the Individual fits checkbox
NLLS-Fit Map Options
After pressing the NLLS Fitting button, the map options are automatically shown at the start of a non-linear least squares (NLLS) map computation.
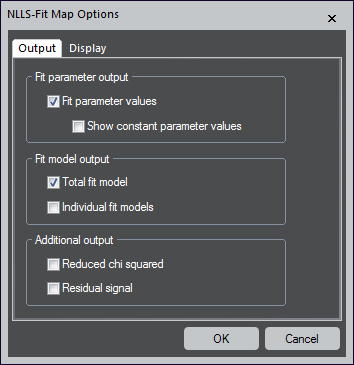 Output
Fit parameter output
- Fit parameter values – Creates a map for each fit-parameter
- Show constant parameter values – When the checkbox is not selected, any fit-parameter that is locked to a fixed value will not produce a map; therefore, the map would be a constant value for all pixels
Fit model output
- Total fit model – Produces an additional spectrum image (SI) dataset that shows the entire fit model – The sum of all individual models
- Individual fit models – Creates additional SI data sets for each model item; the option is not available if there is only one item in the list
Additional output
- Reduced chi-squared – Generates additional maps that show the reduced chi-squared value (the root of the squared sum overall differences between model and data)
- Residual signal – Produces an additional SI dataset that displays the residual signal (the difference between model and data)
Display
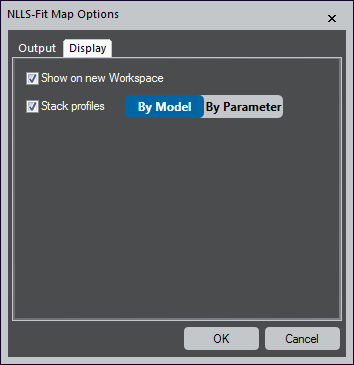 The display options depend on the type of spectrum image and the number of model items in the list. For line scan data, maps become profiles.
- Show on new Workspace – Shows the mapping results on a separate workspace
- When not checked, arranges the mapping results on the largest free area of the current workspace
- Colorize maps – Colorizes the fit-parameter maps using black-to-color gradients (the same color is used either for all parameters of each model item or all parameters of the same name)
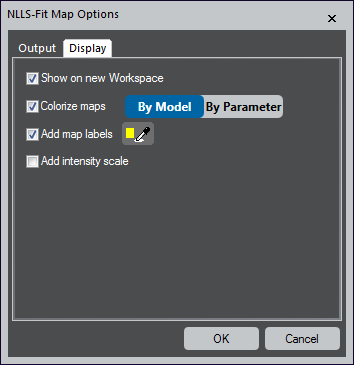 Add map labels – Adds label annotations to all maps – Use the color-picker button to specify the color of the annotation
- Add intensity scale – Includes an intensity scale annotation on all maps
- Stack profiles – For line scan data, maps become profiles
When checked, this option compiles all profile data into a single line-plot display showing multiple slices. All parameters of each model item or the same name are stacked into a single display.