Select the field of view to map
The field of view is determined by the scanning (SEM) magnification setting or scanning transmission electron microscope (STEM). Please consult your microscope manual for details.
Acquire a map
 There are three methods to collect cathodoluminescence (CL) maps: Unfiltered, wavelength-filtered, and color. The appropriate method depends on the type of detector you use. See the modes of operation section for more details.
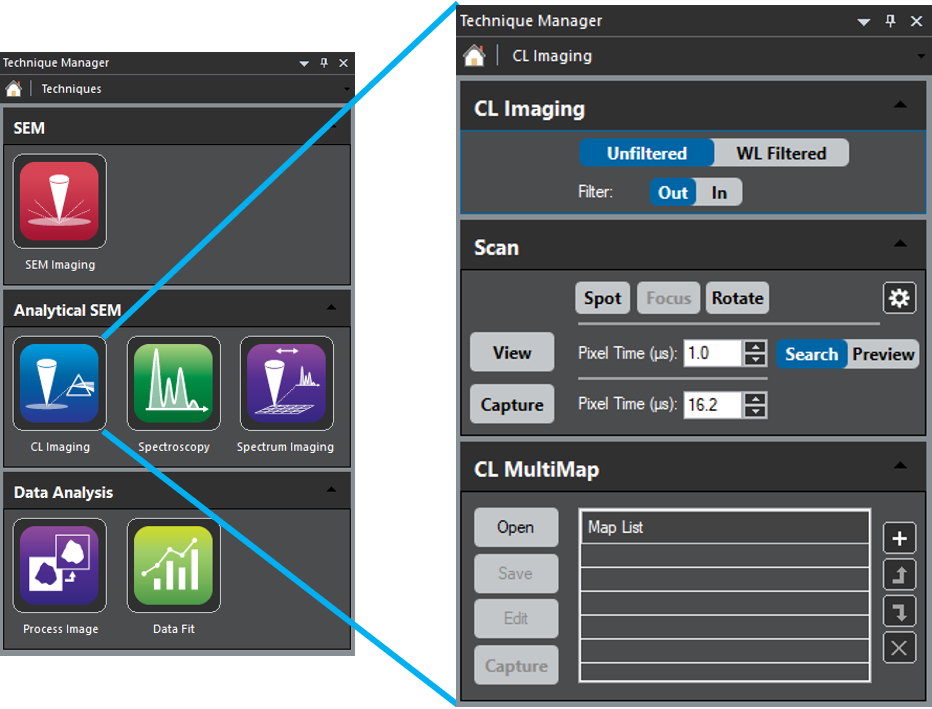
Within DigitalMicrograph® software, go to the CL Imaging or ChromaCL™ technique to collect a map. Regardless of the technique (CL Imaging or ChromaCL), the Scan dialog can collect SEM or STEM images within the DigitalMicrograph software.
- Spot, Focus, Rotate buttons – Control the electron beam: Spot – Sets the beam at a particular location on (or to avoid damage, off of) the specimen, Focus – Scans a sub-region to focus an image.
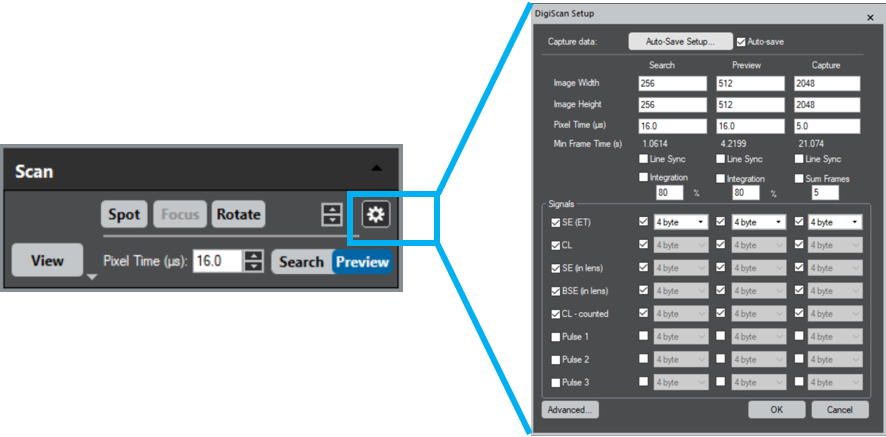
- Setup – Defines the images' pixel time, width, and height (pixels). We recommend capturing at least one signal in addition to the CL signal.
- View – Enables live viewing of SEM or STEM images. When selected, a new image display window opens on the View workspace for each signal you choose within the setup dialog.
- Capture – Records an image using the Capture setting of the DigiScan Setup dialog.
Note: The Scan dialog does not control the type of CL information in a CL map captured by the DigiScan™ system. Instead, the type of detector and acquisition mode you use define the CL information.
ChromaCL color maps
The ChromaCL detector is configured to provide color CL maps. If applicable, simply select the ColorRGB signal alongside the SE and BSE signals in the DigiScan Setup box.
CL maps with Monarc and Vulcan
 Collect a broader range of CL maps with Monarc® and Vulcan® spectroscopic CL detectors. From the CL Imaging palette, configure the spectrograph and detector for the appropriate acquisition mode:
Unfiltered – In this mode, the light bypasses the spectrograph, and the following options are available:
- Filter = In – Selects an optical filter to modify the signal reaching the detector. A drop-down menu allows the user to select one of the five filters installed in the system.
- Polarizer = In or Out – Moves a rotatable polarization filter in or out of the beam path. The user can define the transmitted polarization angle by entering a 0 – 180° range value in the polarization angle text box.
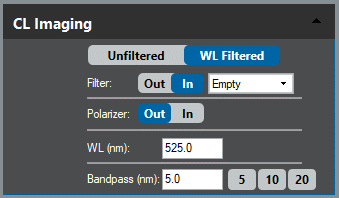
WL Filtered (wavelength-filtered) mode – Focuses photons onto the entrance slit of the spectrograph and disperses them by wavelength (energy). This uses a wavelength-selecting slit to allow a specific range of wavelengths to pass through the system.
- WL (nm) – Sets the wavelength of light that passes through (the center of) the exit slit.
- Bandpass (nm) – Defines the range of wavelengths.
Note that the band pass is the wavelength range that exits the optical spectrograph. For example, when the spectrograph wavelength is set to 525 nm, a band pass of 5 nm corresponds to light in the wavelength range 522.5 – 527.5 nm passing through the spectrograph.
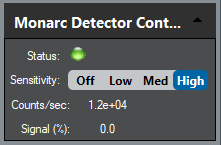 During CL Imaging, a photomultiplier tube (PMT) or diode measures the CL intensity at each pixel. The size of the CL signal can change by many orders of magnitude depending on the sample, SEM settings, and spectrometer state. Use the Detector Control palette to increase or decrease the sensitivity of the CL system.
Note that for PMT detectors, two different DigiScan signals are available: CL Analog and CL Counted. These two DigiScan signals sense the same output from the detector but process the signals differently. The analog signal provides a wider dynamic range, while the counted signal offers a higher signal-to-noise ratio. In many cases, the counted signal is most appropriate, but in the case of very strong emission, the analog signal may be of benefit.
Recipe-driven acquisition of maps (Monarc only)
DigitalMicrograph software allows you to define, recall, and execute a sequence of maps using the MultiMap palette. When the + icon is selected, the software stores the current DigiScan, spectrograph, and detector settings and then defines a sequence of maps. The user may name these steps to their liking and save a recipe for recall later.