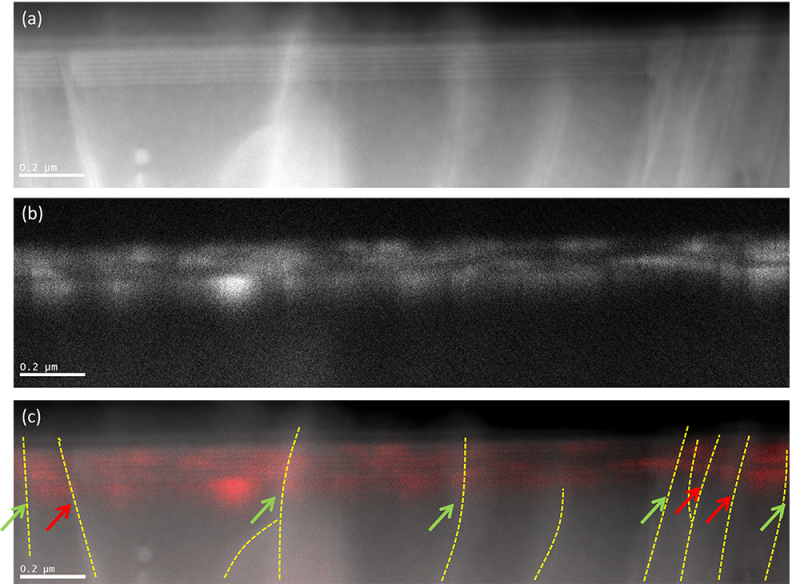
(a) Dark field STEM image revealing six 3 nm thick InGaN wells; (b) Cathodoluminescence (CL) image of same region (acquired simultaneously) showing up to 20x variation in the luminescence efficiency locally; (c) Overlay of DF and CL STEM images with the position of threading dislocations shown by yellow dotted lines. Some dislocations quench the quantum well luminescence (red arrows) while others have no effect, or actually enhance emission (green arrows). Methods prepared in cross section using PIPS TEM sample preparation tool from Gatan acquired using JEOL 2100F STEM mode 200 kV sample temperature of 100 K.
Resource category