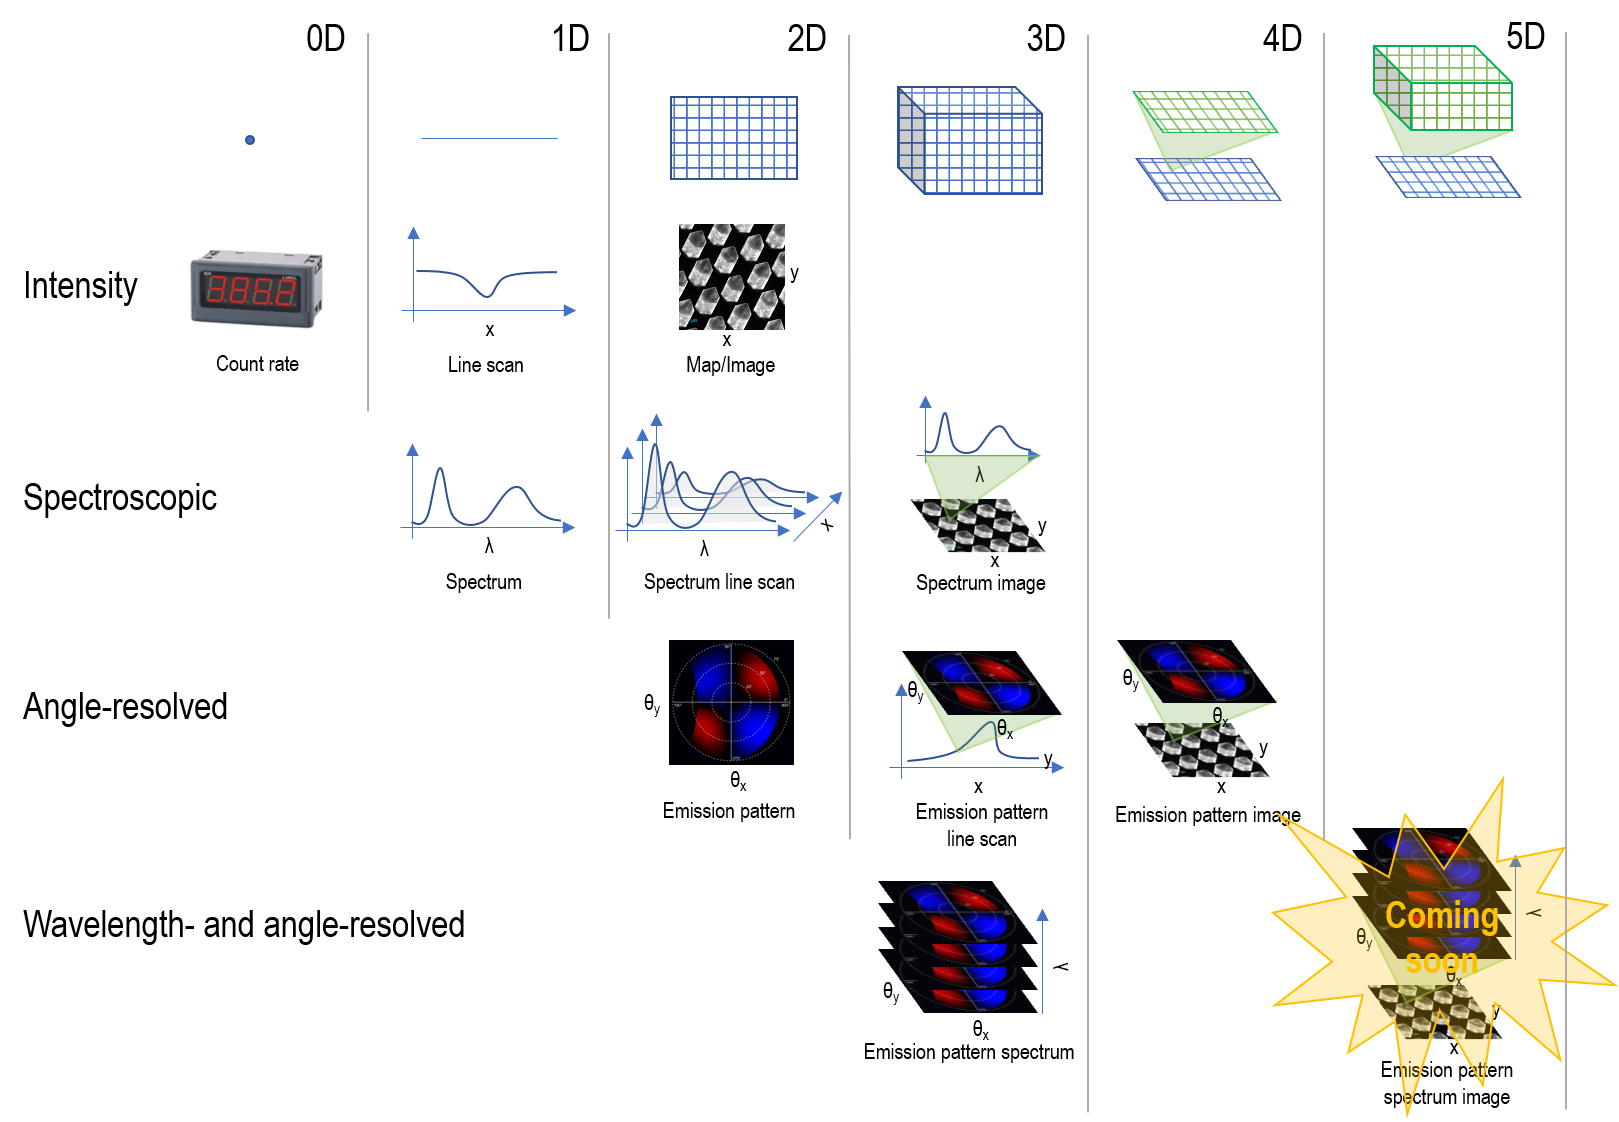
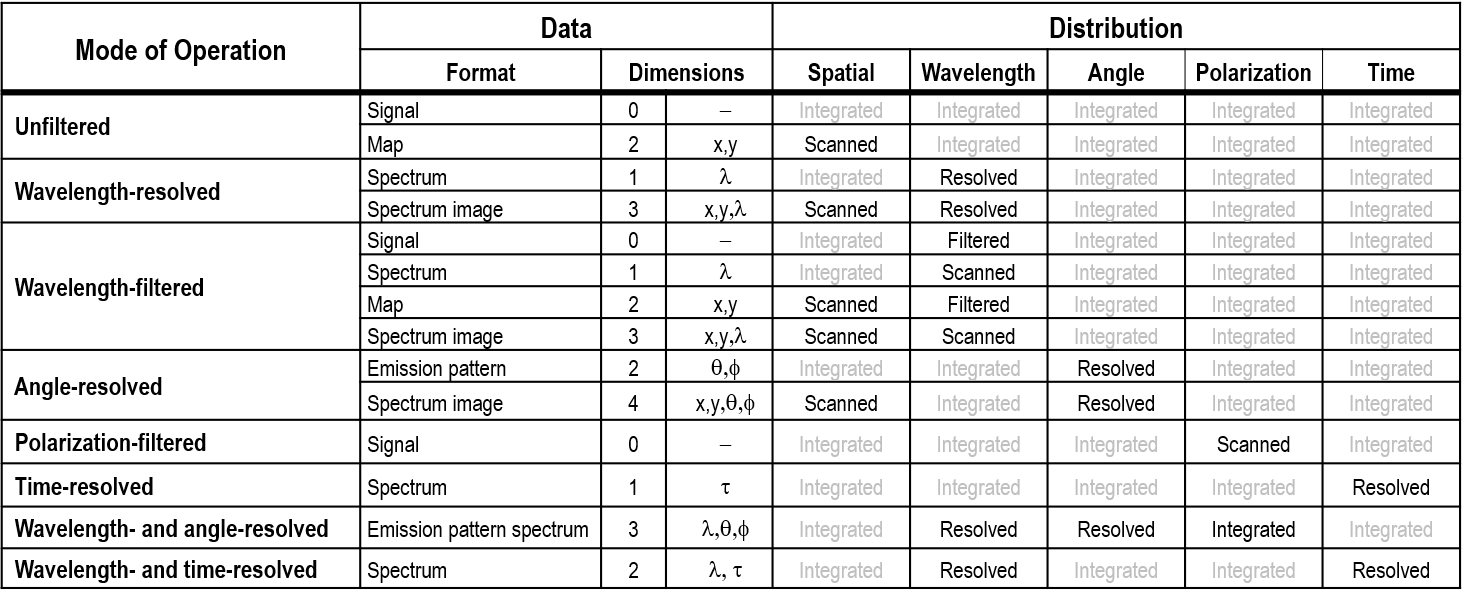
You can define the light emission during the cathodoluminescence (CL) process by its distributions in:
- Wavelength (color or energy)
- Angle (momentum)
- Polarization
- Time
During a CL measurement, you can analyze one or more of these distributions. Analyses can originate from a single, user-defined spot or area on the surface of a specimen or in a spatially resolved manner. In other words, when the electron beam scans across the specimen surface in a pre-defined pattern, it captures the light distribution(s) of interest at each step.
The term –filtered describes analysis modes that select a single or small range of wavelength, angle, or polarization distributions, whereas –resolved designates recording an entire distribution (in parallel).
In some advanced analysis methods, you can measure more than one distribution. In these cases, the data may be described in a string—for example, polarization-filtered emission pattern or wavelength– and time-resolved spectrum.
For a more detailed chart, please see the download that is available.
 |
Investigating the optical properties of nanophotonic materials far below the diffraction limit |