Showing 31-40 of 42
  • Media image
    Data courtesy of Prof. Nicholas Leventis, Chemistry Department, Missouri University of Science and Technology

    Cathodoluminescence image of paint pigment sample prepared with Ilion II and imaged with MonoCL4™ system.

  • Media image
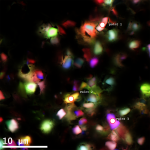
    Data courtesy of Dr. R. Williams, Ohio State University

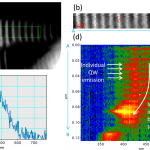
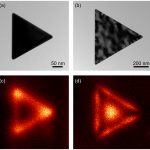
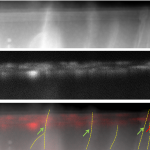
    Cathodoluminescence analysis of a GaN/AlN nanowire in STEM (a) Dark field STEM image, (b) cathodoluminescence spectrum-image acquired from the region indicated by the green rectangle in (a), (c) A cathodoluminescence spectrum extracted from the spectrum-image, and (d) a projection of the cathodol

  • Media image

    Panchromatic cathodoluminescence image of bulk GaN sample. Dark spots (some indicated by blue arrows) correspond to threading dislocations. A dislocation density of 5 x 105 cm-2 was measured. Acquisition time = 30 s.

  • Media image
    Data courtesy of G Nichols, Pfizer UK

    Distribution of drug within a pharmaceutical pill. Composite color image showing the spatial distribution of the micronized drug, salmeterol xinafoate.

  • Media image
    Data courtesy of Dr. M. Bosman, A*STAR IMRE, Singapore

    Cathodoluminescence investigation of gold prisms in the STEM: (a) and (b) are bright field TEM images and (c) and (d) are the cathodoluminescence intensity maps recorded in STEM mode from particles (a) and (b) respectively.

  • Media image
    Images (a), (b) and (d) –(f) courtesy of Dr. J. Schieber, Indiana University.

    Color cathodoluminescence reveals provenance of populations of quartz grains (a) Cleveland shale (Devonian); low grade metamorphic acadian orogeny; (b) Barnett shale (Miss.) Texas; low grade metamorphic ouchita orogeny; (c) Unspecified; (d) Santa Barbara basin shale (modern); plutonic (Sierra Nev

  • Media image
    Image courtesy of Dr. J. Schieber, Indiana University.

    Quartz grains from granite and metamorphic source with low temperature quartz cement (bluish). There is a later (hotter) overprint (reddish) along grain boundaries in the overgrowth.

  • Media image
    Data courtesy of Dr. G. Fern, ETC, University of Brunel

    Cathodoluminescence spectrum of Europium-doped yttrium oxide particle measured with Vulcan system.  Europium ion d-to-f interband transitions produce narrow emission lines; excellent energy resolution of Vulcan™ system resolves two spectral peaks with peak-to-peak separation of only 1.6 meV.  

  • Media image
    Sample courtesy of J. Griffiths, University of Cambridge

    (a) Dark field STEM image revealing six 3 nm thick InGaN wells; (b) Cathodoluminescence (CL) image of same region (acquired simultaneously) showing up to 20x variation in the luminescence efficiency locally; (c) Overlay of DF and CL STEM images with the position of threading dislocations shown by

  • Media image

    Cathodoluminescence (CL) and EELS analysis of gold prism of 250 nm side length.